Fun Facts May 13, 2022

Inventory Bottom

In Front Range markets, the number of homes for sale has just hit bottom or is about to hit bottom.

This is terrific news for home buyers who have been waiting for more homes to choose from.

The market is shifting, there is no doubt about that.

Prices are still increasing and we expect them to increase, just not at the pace they have been.

The inventory of homes for sale, which has been significantly down for two years, is finally starting to show signs of change.

We have been accustomed to inventory levels being down 30% to 50% compared to the prior year.

That is not the case anymore.

Inventory in Larimer and Weld County is now only down roughly 5% year over year.

Inventory in Metro Denver is now up 13.5% compared to this time in 2021.

We believe this is a legitimate shift in the market, not just a short-term anomaly.

No need to worry about prices crashing or a housing bubble.  There is still too little supply and too much demand for that to happen.

However, the pace of price of appreciation will certainly get back to more normal levels of 5% to 6% per year instead of 20% to 25% per year.

Bottom line, this market shift has been a long time coming and is very good news for buyers.​​​​​​​ 

Economics 101 April 29, 2022

Expert Opinion

This week, take a listen to Matthew Gardner, Windermere’s Chief Economist as he discusses the current state of the housing market.​​​​​​​


He takes a deep dive into interest rates, price appreciation and where the market is headed.


You can watch his video HERE


Colorado Housing April 22, 2022

Half A Month

There is half of a month of inventory on the market.  In other words, at the current pace of sales, it would take just two weeks to sell all of the homes currently listed for sale along the Front Range.

By definition, a market is balanced when there is 4 to 6 months of inventory.  Anything less than that is a seller’s market.

The current inventory levels give us confidence about the future of price growth along the Front Range.

While we expect the pace of price appreciation to slow, the low supply of properties insulates us against any sort of price decline.

Housing Trends March 4, 2022

Townhome Surge

Townhome construction has surged in the last 12 months.  This is welcome news for first-time buyers who benefit from the lower prices that multi-family product tends to provide.

According to the National Association of Home Builders, townhome construction has jumped up 28% compared to the previous year.

Townhomes now represent 13% of all new residential construction starts.


BlogFun FactsReal Estate News November 5, 2021

Zillow’s Shut Down

On Wednesday Zillow announced the shut down of its iBuying program because of mounting financial losses and increasing complexity in the real estate market.

The goal of this program was to buy properties directly from Sellers and then re-sell them for a profit.

Before looking at the interesting facts and numbers associated with this news, we want to acknowledge the people who are affected by this.

Zillow’s workforce will be reduced by 25%.  Many people will be laid off and our heart goes out to them.  We certainly wish them only the best.

Within our company we are not surprised by Zillow’s announcement.  We observed many cases where they over-paid for a property, re-listed it for an unrealistic price, dropped the price over time to meet the market, and then sold at an amount much less than what they paid.

It actually became difficult to find specific scenarios where they sold the home for more than their acquisition cost.  It was not uncommon to see losses of $50,000 per home or more.

Here is a quote from their CEO:  “Our observed error rate has been far more volatile than we thought possible.  Fundamentally, we have been unable to predict future pricing of homes to a level of accuracy that makes this a safe business to be in.“

In the third quarter of 2021 alone, their iBuying division lost $328 million.

Bottom line, their valuations were off.

It is a reminder that pricing requires a hyper-local scientific approach versus a generic algorithm

Homes are not commodities.  Each home is highly unique.  Each has its own highly unique location, features, amenities, condition and timing.

Homes can’t be priced like a book or a plane ticket.  Every unique feature must be taken into account.

Nationally, Zillow has about 7,000 homes in backlog which it hopes to sell over the next several months.

Other players remain in the iBuying game and we are more than happy to help you understand those options if you are curious.

BlogFun FactsReal Estate Statistics October 15, 2021

In Perspective

Let’s put today’s home prices in perspective.

Appreciation has been significant over the last 18 months. Some people are wondering if it can last and if there might be a housing bubble.

There are two ways to look at prices. One way is in absolute terms. This is simply looking at the dollar amount a home would sell for at some point in the past versus the dollar amount it would sell for.

The other way is in real terms. ‘Real’ is an economics term which means that inflation is factored into the valuation.

For example, a gallon of milk costs more today in absolute terms than it did 15 years ago. However, in real terms, the cost is about the same as 15 years ago because inflation is factored in. The price of milk has essentially escalated at the same rate as inflation.

So, how about home prices? As we know, prices in absolute terms are higher than 15 years ago. To be exact, prices are 43% higher Nationally compared to 2006 according to Case-Shiller.

However, in real terms, prices are the same as 2006.

Over the last 15 years, homes have appreciated at essentially the same rate as inflation.

BlogColorado Real EstateFun FactsMarket News June 11, 2021

Colorado Ranking

Here’s the latest from one of our favorite data sources – the Federal Housing Finance Authority (FHFA).

They track home prices across the Country and produce a quarterly Home Price Index report.

It is not uncommon to find Colorado near the top of the list for year over year price growth.

The latest report has us ranked 13th with only a 13% year over year increase (said with sarcasm).

Idaho is first with a whopping 24% increase. Utah is second at 19%.

Here is our interpretation of these numbers…

Colorado has a history of strong, steady price growth instead of booms and busts.

Our market does not take the big, wild swings in prices that other markets sometimes do.

The fact that Colorado is not at the very top of the list right now is actually good news to us.

We know that our clients appreciate a market that is more steady instead of one that can feel like a rollercoaster.

BlogBuyers & SellersColorado Real EstateMarket NewsNorthern Colorado Real EstateReal Estate Market Update April 28, 2021

Q1 2021 Colorado Real Estate Market Update

The following analysis of the Metro Denver & Northern Colorado real estate market is provided by Windermere Real Estate Chief Economist Matthew Gardner. We hope that this information may assist you with making better-informed real estate decisions. For further information about the housing market in your area, please don’t hesitate to contact your Windermere Real Estate agent.

REGIONAL ECONOMIC OVERVIEW

Following the decline in employment last winter, Colorado has started to add jobs back into its economy. The latest data shows that the state has now recovered more than 219,000 of the 376,000+ jobs that were lost due to COVID-19. This is certainly positive, but there is a long way to go to get back to pre-pandemic employment levels. Denver and Fort Collins continue to have the greatest improvement in employment, but all markets show job levels well below pre-pandemic levels. With total employment levels rising, the unemployment rate stands at 6.6%, down from the pandemic peak of 12.1%. Regionally, unemployment levels range from a low of 5.6% in Fort Collins and Boulder to a high of 6.7% in Greeley. COVID-19 infection rates have started to increase again, and this has the potential to negatively impact the job market. I am hopeful that the state will not be forced to pull back reopening, but this is certainly not assured.

COLORADO HOME SALES

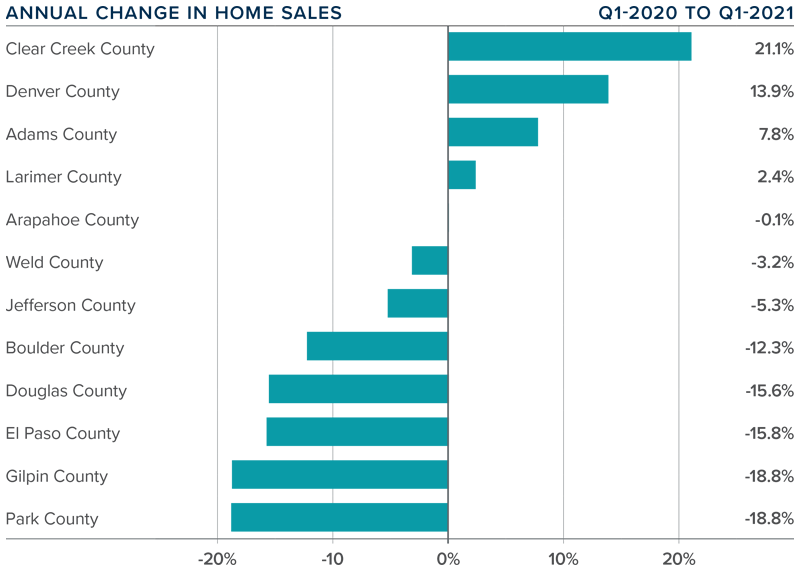
❱ 2021 started off on a bit of a sour note, with total sales down 1.2% compared to the same period in 2020. Sales were 29.2% lower than in the final quarter of 2020 as 8,645 homes sold.

❱ Sales were higher in four of the counties contained in this report, were essentially flat in one, and dropped in seven. It was pleasing to see significant sales growth in the large counties of Denver and Adams.

❱ Another positive was that pending sales, which are an indicator of future closings, were 4.8% higher than in the fourth quarter of 2020 and 5% higher than a year ago.

❱ The disappointing number of home sales overall can primarily be attributed to the woeful lack of inventory. Listings in the quarter were down more than 61% year over year and were 40.6% lower than in the fourth quarter of 2020.


COLORADO HOME PRICES

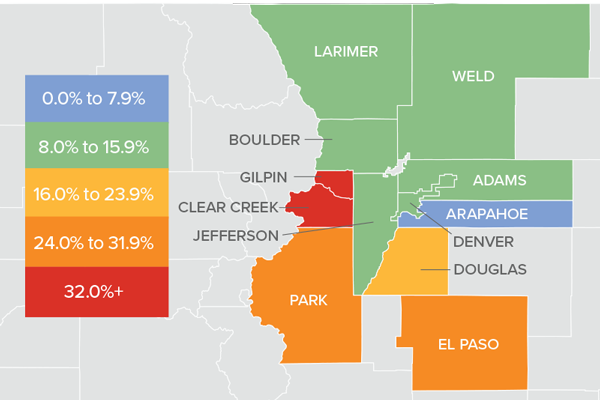
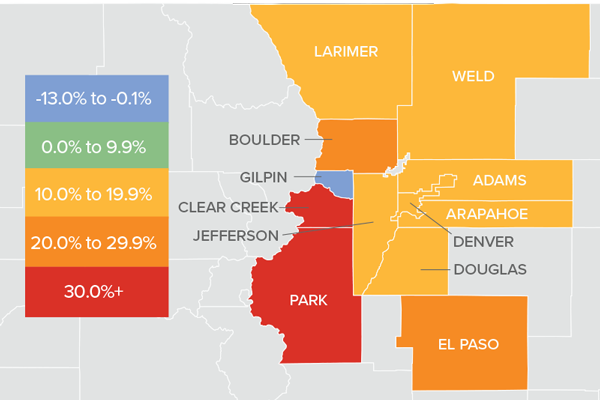
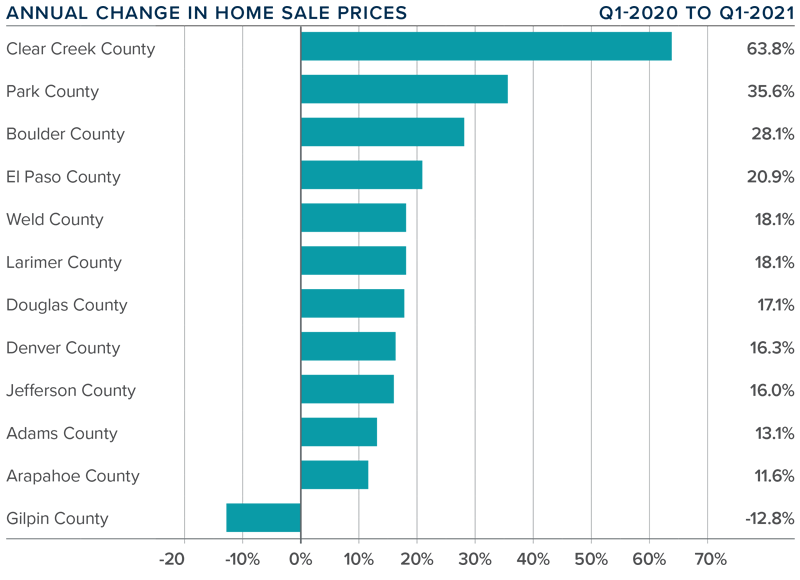
❱ Prices continue to appreciate at a very rapid pace, with the average sale price up 16.5% year over year, to an average of $556,100. Home prices were also 4.4% higher than in the fourth quarter of 2020.

❱ Buyers appear to be out in force, and this demand—in concert with very low levels of inventory—continues to heat the market.

❱ Prices rose over last year across all markets covered by this report, with the exception of the very small Gilpin County. All other counties saw sizeable gains and the trend of double-digit price growth continued unabated.

❱ Affordability levels are becoming a greater concern as prices rise at a far faster pace than wages. Even though mortgage rates have started to rise, they haven’t yet reached the level needed to take some of the heat out of the market.


DAYS ON MARKET

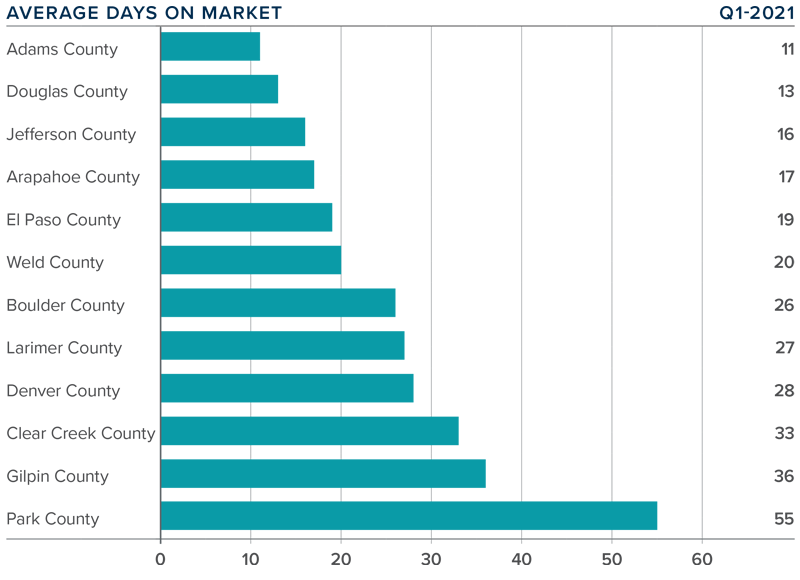
❱ The average time it took to sell a home in the markets contained in this report dropped 20 days compared to the first quarter of 2020.

❱ The amount of time it took to sell a home dropped in every county contained in this report compared to the fourth quarter of 2020.

❱ It took an average of 25 days to sell a home in the region, down one day from the fourth quarter of 2020.

❱ The Colorado housing market remains very tight, as demonstrated by the fact that it took less than a month for homes to sell in all but two counties.


CONCLUSIONS

This speedometer reflects the state of the region’s real estate market using housing inventory, price gains, home sales, interest rates, and larger economic factors.

The relatively low level of home sales is not a surprise given how few choices there are for buyers. Sellers are certainly benefitting from strong demand, as demonstrated by the significant price growth. I maintain my belief that there will be an increase in inventory as we move through the year, but it is highly unlikely that we will see a balanced market in 2021.

Given these factors, I am moving the needle a little more in favor of sellers, as demand is likely to continue to exceed supply.

ABOUT MATTHEW GARDNER

As Chief Economist for Windermere Real Estate, Matthew Gardner is responsible for analyzing and interpreting economic data and its impact on the real estate market on both a local and national level. Matthew has over 30 years of professional experience both in the U.S. and U.K.

In addition to his day-to-day responsibilities, Matthew sits on the Washington State Governors Council of Economic Advisors; chairs the Board of Trustees at the Washington Center for Real Estate Research at the University of Washington; and is an Advisory Board Member at the Runstad Center for Real Estate Studies at the University of Washington where he also lectures in real estate economics.


BlogEconomyFor BuyersFor SellersFun FactsHomes for SaleHousing Trends March 19, 2021

107 Straight

According to research from the National Association of Realtors, home prices have appreciated for 107 straight months.


The median price in the U.S. is now $309,000.


The U.S. region with the highest median price is the West at $461,800. The lowest is in the South at $263,300.


All regions showed double-digit price appreciation from one year ago.


While prices are going up all across the U.S., inventory is going down. The number of properties for sale has declined for 20 straight months.


Low inventory and high demand are causing properties to sell quickly. It now takes an average of 21 days for a property to go under contract compared to 43 days one year ago.


So, the dynamics we notice locally are also occurring nationally.

BlogColorado HousingColorado Real EstateDenver Real EstateEconomyHousing TrendsMarket NewsWindermere Real Estate February 3, 2021

Q4 2020 Colorado Real Estate Market Update

The following analysis of the Metro Denver & Northern Colorado real estate market is provided by Windermere Real Estate Chief Economist Matthew Gardner. We hope that this information may assist you with making better-informed real estate decisions. For further information about the housing market in your area, please don’t hesitate to contact your Windermere agent.


REGIONAL ECONOMIC OVERVIEW

The job recovery that appeared to be firmly in place in the summer has started to wane. Though Colorado has recovered more than 209,000 of the jobs lost due to COVID-19, employment levels remain almost 210,000 below the level seen last February. Even with employment growth stalling, the unemployment rate stands at a relatively respectable 6.4%, down from a peak of 12.2%. Regionally, unemployment levels range from a low of 5.4% in Boulder to a high of 6.9% in Greeley. Rising COVID-19 infection rates continue to impact the job recovery, and I do not see much in the way of palpable improvement until a vaccine becomes freely available, likely in the second half of this year.

COLORADO HOME SALES

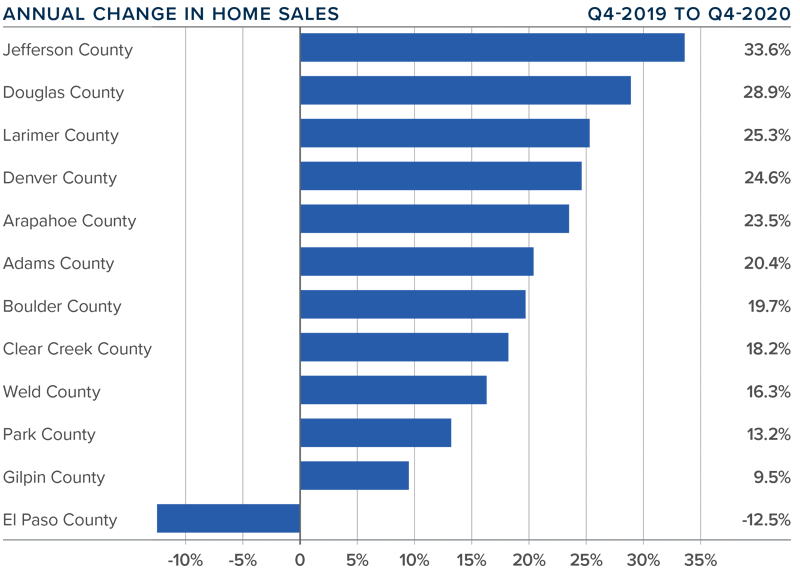
❱ In the final quarter of 2020, 12,207 homes sold. This represents an increase of 21.8% compared to the fourth quarter of 2019, but 19% lower than in the third quarter. I am not concerned, though, because seasonal influences tend to impact sales in the winter.

❱ Sales rose in all markets other than El Paso compared to the fourth quarter of 2019. I believe sales are only limited by the number of homes on the market.

❱ Inventory levels remain well below what I would like to see. The average number of homes on the market in the fourth quarter was down 55% from the same period in 2019.

❱ Pending sales were 34% lower compared to the third quarter. Again, seasonality and a lack of homes to buy impact this figure. Pending sales are still 13% higher than a year ago.
Colorado Counties Graph

COLORADO HOME PRICES

Price appreciation in various Colorado counties.

❱ Home prices rose significantly in the fourth quarter, with the average price increasing 13.7% year-over-year to $532,492. Prices were up 1.8% compared to the third quarter of this year.

❱ Interest rates are unlikely to drop much further and this will lead price growth to slow as we move through 2021.

❱ Year-over-year, prices rose across all markets covered by this report, with significant appreciation in Clear Creek, Gilpin, Park, and El Paso counties. Every county but Arapahoe saw double-digit price gains.

❱ Affordability in many Colorado markets remains a concern as prices continue to rise at well-above-average rates. That said, I anticipate we will see price growth moderate in 2021.
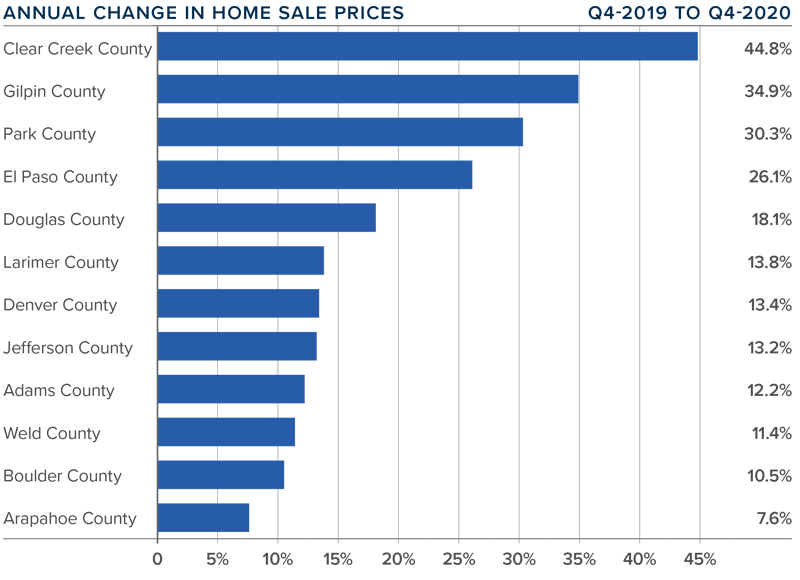
A bar graph showing the annual change in home sale prices in various Colorado counties.

DAYS ON MARKET

❱ The average number of days it took to sell a home in the markets contained in this report dropped 15 days compared to the final quarter of 2019.

❱ The amount of time it took to sell a home dropped in every county contained in this report compared to the fourth quarter of 2019.

❱ It took an average of 26 days to sell a home in the region, down 3 days compared to the third quarter of 2020.

❱ The Colorado housing market continues to demonstrate solid demand, and buyers are clearly competitive as suggested by the short length of time it is taking to sell a home.
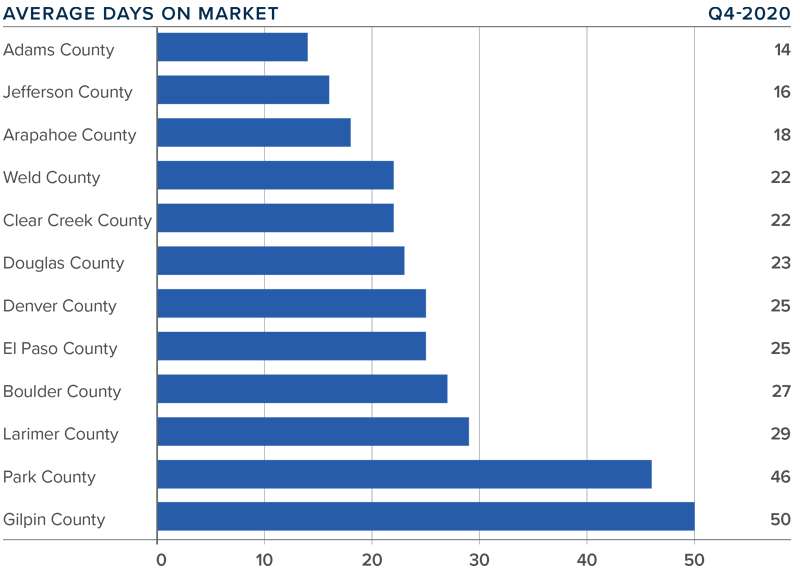
A bar graph showing the average days on market for homes in various Colorado counties

CONCLUSIONS

A speedometer graph indicating a seller's market in Colorado.

This speedometer reflects the state of the region’s real estate market using housing inventory, price gains, home sales, interest rates, and larger economic factors.

Home sales and prices are significantly higher than a year ago, and demand for housing is very much in place. Naturally, this favors home sellers who are still in control of the market. I do expect to see some improvement in listing activity this year, which, in concert with modestly rising interest rates, will likely start to take some of the steam out of the market. However, any moderation in the market has yet to appear. Even given the possible headwinds mentioned above, I am moving the needle a little more in favor of sellers, as demand is likely to exceed supply for the time being.


ABOUT MATTHEW GARDNER

Matthew Gardner - Chief Economist for Windermere Real Estate

As Chief Economist for Windermere Real Estate, Matthew Gardner is responsible for analyzing and interpreting economic data and its impact on the real estate market on both a local and national level. Matthew has over 30 years of professional experience both in the U.S. and U.K.

In addition to his day-to-day responsibilities, Matthew sits on the Washington State Governors Council of Economic Advisors; chairs the Board of Trustees at the Washington Center for Real Estate Research at the University of Washington; and is an Advisory Board Member at the Runstad Center for Real Estate Studies at the University of Washington where he also lectures in real estate economics.