
 Facebook
 Twitter
 Pinterest
 Copy Link
At Least List

Periodically we track a stat which we find to be quite interesting.
It answers this question – how many properties are selling for at least list price (asking price or higher)?
This stat tells us how active the market is and helps our buyers to realize that, in some cases, they will be in a competitive situation.
When we look at single-family home sales so far this month, this is what we find:
- 57% of properties in Larimer County sell for at least list price
- 62% of properties in Weld County sell for at least list price
So, in well over half of the transactions, buyers need to offer list price or higher to acquire the property.
The data gets even more interesting when this information is broken out by price range.
To no one’s surprise, the percentage increases for properties priced under $400,000:
- 81% in Larimer County
- 70% in Weld County
We find that for properties over $400,000 the percentages still tell a story of a very active market:
- 47% in Larimer County
- 56% in Weld County
Bottom line, in most locations and price ranges we see a strong sellers’ market where buyers need to be prepared to make a strong offer and to also compete.
Housing Math

It’s interesting to look at what population growth means for housing.
On average, along the Front Range, 2.5 people live in each housing unit.
What that means is 4 housing units are needed for every 10 people who live here.
So, for every 1000 new people moving to our area, 400 new housing units are required.
The population of Metro Denver is just under 3,000,000 and the population of Northern Colorado is just over 650,000.
Assuming the Front Range grows in population at 2% per year, that means 60,000 new people in Metro Denver and 13,000 new people in Northern Colorado each year.
To house those people, 24,000 new housing units need to be built per year in Metro Denver and 5,200 in Northern Colorado.
More Homes Needed

The market is in short supply.
More homes are needed to fulfill the need to buyer demand.
Compared to exactly one year ago, the supply of homes is down:
- 32.6% in Metro Denver
- 25.1% in Northern Colorado
An interesting and useful measurement we track is months of inventory. This stat tells how long it would take to sell all of the homes currently for sale at the current pace of sales.
Of course, months of supply can vary greatly by price range and location. However, this stat does a good job of explaining the overall state of the market.
Specifically, months of supply tells us if the market is in balance.
A ‘balanced’ market is when there is 4 to 6 months of supply. A buyers market occurs when the stat is higher than this range. A sellers market occurs when it is lower.
The months of supply looks like this in our market:
- 1.0 months in Metro Denver
- 1.3 months in Northern Colorado
So, the market overall is significantly under-supplied and more homes are needed to meet demand.
Caught Up

We’ve been waiting for June to catch up. It finally happened (almost).
Back in April, real estate activity was significantly limited and the showing of property was restricted which caused the number of closed properties in May and early June to be much lower than last year.
Bottom line, fewer properties going under contract in April caused fewer closings 30 to 45 days later.
Closed properties in May were down compared to 2019 by 44% in Northern Colorado and 43% in Metro Denver.
Then activity jumped significantly in May. The number of properties going under contract was way up compared to last year.
We’ve been wondering when we would see this sales activity reflected in the number of closed properties.
Well, it finally happened (almost).
The number of closings so far in June compared to the same time period through June of 2019 is only down 1.8% in Northern Colorado and 1.6% in Metro Denver.
In both markets, there are only a handful of closings separating activity in June 2020 versus June 2019.
By the end of the month, when all the transactions are tallied up, we expect that June of this year will out pace June of last year in terms of number of transactions.
This is significant not only because of COVID-19, but also because of the reduced inventory compared to last year. Quite simply, there are fewer homes to buy.
All of this speaks to the health and resiliency of the Front Range market.
What the Numbers Say

April represents the first time we can look at the impact of COVID-19 on a full month of real estate activity.
To no one’s surprise, activity in April in terms of closings and new contracts did slow significantly.
Much of this slowing was caused by in person showings not being allowed for most of the month.
(showings are now allowed again by following Safe Showings protocols)
Here’s what the numbers say…
Closed transactions were down compared to April 2019
- 26% in Northern Colorado (Larimer & Weld)
- 27% in Metro Denver
New written purchase agreements were down compared to April 2020
- 48% in Northern Colorado
- 44% in Metro Denver
So, while activity did slow, there was nothing resembling a “screeching halt” that took place.
While the way property is shown has certainly changed, the market is still very active and we expect activity to increase even more with showings now being allowed again.
Lovely Stats

In honor of Valentine’s Day, here are some Northern Colorado stats we think you will love:
- Prices are up 3.5% compared to last year
- Inventory is up 10% which means there is more selection for buyers
- We just had the most active January in terms of closings in over 10 years
- Well over 13,000 residential properties representing $5.4 Billion of volume has sold in the last 12 months
If you would like to see a video recap of our annual Market Forecast you can watch that HERE.
Colorado Real Estate Market Update


The following analysis of the Metro Denver & Northern Colorado real estate market is provided by Windermere Real Estate Chief Economist Matthew Gardner. We hope that this information may assist you with making better-informed real estate decisions. For further information about the housing market in your area, please don’t hesitate to contact your Windermere real estate agent.
ECONOMIC OVERVIEW
Colorado’s economy picked up, adding 64,900 new non-agricultural jobs over the past 12 months — a growth rate of 2.4%. Over the past three months, the state added an impressive 28,300 new jobs.
In August, the state unemployment rate was 2.8%, down from 3.4% a year ago. Unemployment rates in all the counties contained in this report were lower than a year ago. It is fair to say that all markets are now at full employment.
HOME SALES
- In the third quarter of 2019, 17,562 homes sold. This is an increase of 5.1% compared to the third quarter of 2018 but 1.6% lower than the second quarter (which can be attributed to seasonality). Pending sales — a sign of future closings —rose 9.7%, suggesting that closings in the final quarter of 2019 are likely to show further improvement.
- Seven counties contained in this report saw sales growth, while four saw sales activity drop. I am not concerned about this because all the markets that experienced slowing are relatively small and, therefore, subject to significant swings.
- I was pleased to see an ongoing increase in the number of homes for sale (+16.9%), which means home buyers have more choice and feel less urgency.
- Inventory levels are moving higher, and demand for housing appears to be quite strong. As I predicted last quarter, home sales rose in the third quarter compared to a year ago.

HOME PRICES
- Home prices continue to trend higher, with the average home price in the region rising 3.8% year-over-year to $477,776.
- Interest rates are at very competitive levels and are likely to remain below 4% for the balance of the year. As a result, prices will continue to rise but at a more modest pace.
- Appreciation was again strongest in Park County, where prices rose 7.8%. We also saw strong growth in Weld County, which rose 7.4%. Home prices dropped in Clear Creek County, but, as mentioned earlier, this is a small market so I don’t believe this is indicative of an ongoing trend.
- Affordability remains an issue in many Colorado markets and this will act as a modest headwind to ongoing price growth.

DAYS ON MARKET
- The average number of days it took to sell a home in the markets contained in this report rose seven days compared to the third quarter of 2018.
- The amount of time it took to sell a home rose in all counties compared to the third quarter of 2018.
- It took an average of 30 days to sell a home in the region — an increase of 1 day compared to the second quarter of this year.
- The Colorado housing market is still performing well, and the modest increase in the length of time it took to sell a home is a function of greater choice in homes for sale and buyers taking a little longer to choose a home.

CONCLUSIONS

This speedometer reflects the state of the region’s real estate market using housing inventory, price gains, home sales, interest rates, and larger economic factors.
For the third quarter of 2019, I continue the trend I started last summer and have moved the needle a little more in favor of buyers. I continue to closely monitor listing activity to see if we get any major bumps above the traditional increase because that may further slow home price growth. However, the trend for 2019 will continue to be a move toward a more balanced market.
ABOUT MATTHEW GARDNER

As Chief Economist for Windermere Real Estate, Matthew Gardner is responsible for analyzing and interpreting economic data and its impact on the real estate market on both a local and national level. Matthew has over 30 years of professional experience both in the U.S. and U.K.
In addition to his day-to-day responsibilities, Matthew sits on the Washington State Governors Council of Economic Advisors; chairs the Board of Trustees at the Washington Center for Real Estate Research at the University of Washington; and is an Advisory Board Member at the Runstad Center for Real Estate Studies at the University of Washington where he also lectures in real estate economics.
How Much?

So how much real estate is sold in Northern Colorado?
As it turns out, a lot!
Last month alone there were 1,099 single family homes that sold in Larimer and Weld Counties
The average price was $429,144 which means the total sales volume for one month was $471,629,129 (almost a half a billion)!
Over the last 12 months, just over $4.5 billion worth of single-family homes have sold.
That’s a lot of real estate!
Gorgeous Two-Story Home in Timnath!
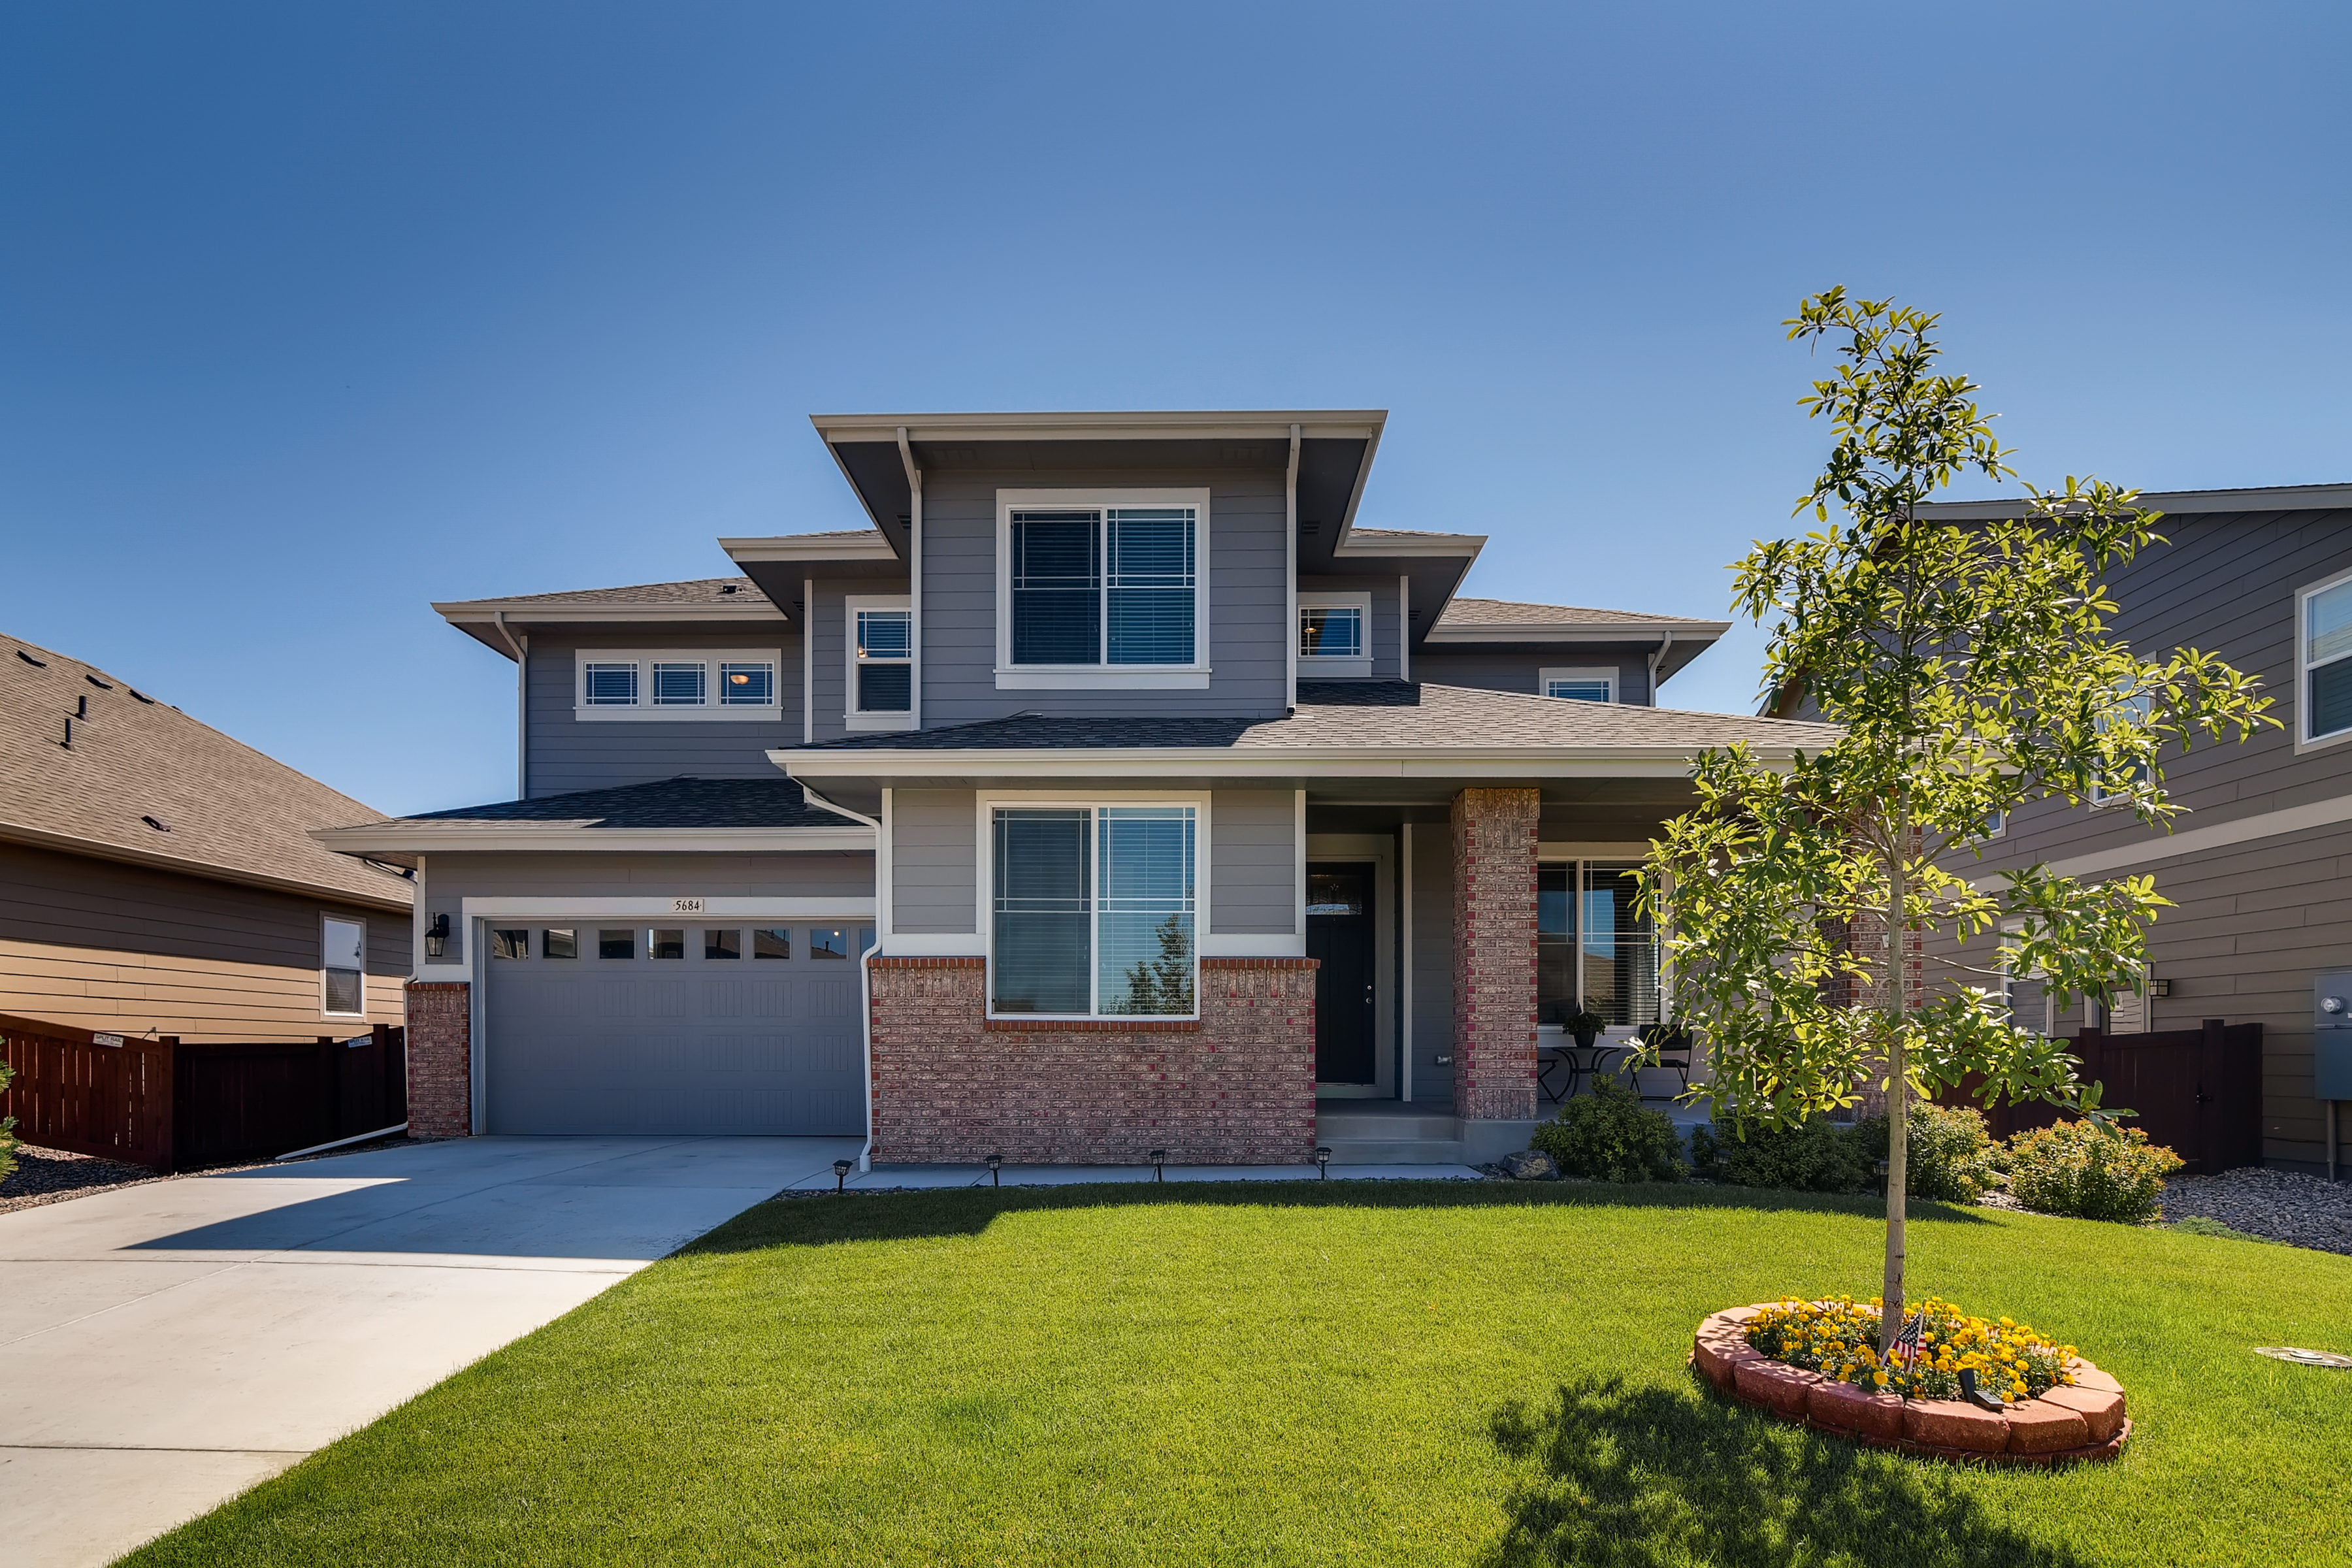
This home at 5684 Connor Street in Timnath in pristine condition features a main floor guest suite and a gourmet chef’s kitchen with granite counter-tops, stainless steel appliances, 36″ gas cook-top and hood. Upstairs features a master’s retreat with a sitting room, 5-piece bathroom suite, dual walk-in closets and views of the greenbelt and mountains. The great room and open kitchen layout allow space to entertain and enjoy the outdoors with an over-sized covered patio. Contact Chris Guillan at (970) 310-9357 for your private showing for more information or click the link below for more details.
Where Are The Sales?

A high-level look at the Northern Colorado region shows that the number of residential sales is down 5.4% in Larimer County and up 4.7% in Weld County. This is simply comparing the number of closings from June 2018 to June 2019 versus June 2017 to June 2018.
The high-level look doesn’t tell the whole story. It get’s more interesting when we look at individual Northern Colorado cities and towns:
• Fort Collins = -8.8%
• Loveland = -5.7%
• Greeley = +11.7%
• Windsor = +16%
• Wellington = -16.9%
• Timnath = +44.1%
• Severance = +20.4%
• Johnstown = -18.7%
• Berthoud = +18.1%
• Evans = -14.7%
So, what can we learn from this? The areas with increased sales are where there is an abundance of new construction (Timnath and Severance for example).
The areas with decreased sales don’t have an abundance of new construction (Fort Collins for example).
The exceptions to this would be Wellington and Johnstown. It appears that there is price sensitivity to the new construction product now being built in these areas. Given rising costs, builders are challenged to deliver a product under $350,000 in these places.
For instance, in Wellington, between June 2017 and June 2018 there were 137 sales of new homes priced under $350,000. Today there are only 6 new homes on the market at that price point.
