Another Meltdown?

This week our Chief Economist took a deep dive into the numbers to examine the current health crisis versus the housing crisis of 2008.
The reason why? People wonder if we are going to have another housing meltdown nationally and going to see foreclosures and short sales dramatically increase.
It turns out that the numbers show that today’s housing environment is quite different than 2007, right before the housing bubble burst.
Specifically, homeowners are in a vastly different situation with their mortgage compared to the pre-Great Recession’s housing meltdown.
In addition to much higher credit scores and much higher amounts of equity compared to 2007, the most significant difference today is in the amount of ARM mortgages.
Back in years leading up to the housing bubble, Adjustable Rate Mortgages were very prevalent. In 2007 there were just under 13 million active adjustable rate loans, today there are just over 3 million.
The number of those ARMs that would reset within three years was 5 million in 2007 compared to only 320,000 today.
It’s those Adjustable Rate loans resetting to a higher monthly payment that caused such a big part of the housing crisis back in 2008 to 2010.
Back then not only was people’s employment impacted, but many were facing increased monthly mortgage payments.
That’s why there were so many foreclosures and short sales in 2008 to 2010.
That is not the case today and one of many reasons why we don’t foresee a housing meltdown.
Special Event

On Wednesday April 22nd you are invited to a special online event with Windermere’s Chief Economist Matthew Gardner.
He will be giving his insights into the U.S. economy and what that means for real estate along the Front Range of Colorado.
You will hear the answers to the biggest questions we are hearing from clients now like “do you think housing prices will crash?”
This event is exclusively for clients and friends of Windermere Real Estate. To receive the registration link simply comment on this blog or reach out to your Windermere real estate broker.
Many of you have heard Matthew speak at our Market Forecast events we hold each year in January. He is famous for making complex economic dynamics very simple to understand.
You will get useful and valuable information which will give you clarity about where the market is headed and when we can expect the economy to improve.
For example Matthew predicts unemployment to hit 15% by the end of June, but then to improve to 8% by year-end and 6% by this time next year.
Again, if you would like the link just comment on this blog or reach out to your Windermere broker.
Leading Indicator

We are watching close to see where the real estate market is headed. Anecdotally we can tell you that the vast majority of transactions that are under contract are still closing. We have seen very few transactions cancel because of employment issues or the wild swings of the stock market.
An interesting leading indicator was announced this week that sheds some light as to where the market is headed. Each week the Mortgage Bankers Association releases their index which tracks new mortgage applications.
They track both purchase applications and refinance applications. To no one’s surprise, the index was down this week but not as much as you may have guessed.
New purchase applications were down 11% compared to the same week this last year. Refinance activity fell more sharply, down 34%.
This is a statistic we will watch closely as time goes on.
County by County

Metrostudy, who in our opinion is the leader in new home research, recently did a study on the average price of a new home in each of the Front Range Counties.
Here are some interesting takeaways…
If you want to find the least expensive new home on the Front Range, the places to look are Weld County and El Paso County.
· Weld County Average New Home Price = $411,269
· El Paso County Average New Home Price = $427,361
The most expensive place for a new home is in Boulder County (no surprise) at $698,208.
Jefferson County has the largest difference between the average price of a new home and the average price of a resale home: $664,600 vs. $510,003.
Here’s the County by County breakdown of the average price of a new single-family home:
· Boulder = $698,208
· Jefferson = $664,600
· Douglas = $624,315
· Broomfield = $612,779
· Denver = $581,480
· Arapahoe = $545,943
· Larimer = $507,105
· Adams = $480,464
· El Paso = $427,361
· Weld = $411,269
All Time High

Home Builder’s confidence in Baby Boomer buyers is at an all time high.
The National Association of Home Builders (NAHB) surveys their members each quarter to discover what they expect of future sales.
The builders base a large part of their answer on how many people are visiting their sales centers and model homes versus the same time last year.
The results in their most recent survey show that builders have never been more confident about buyers who are 55 and older.
The confidence index for this age group is actually double of what it was in 2012. The NAHB sites low interest rates and strong job growth as the reasons for the high confidence.
Time for New

Here is a fact…
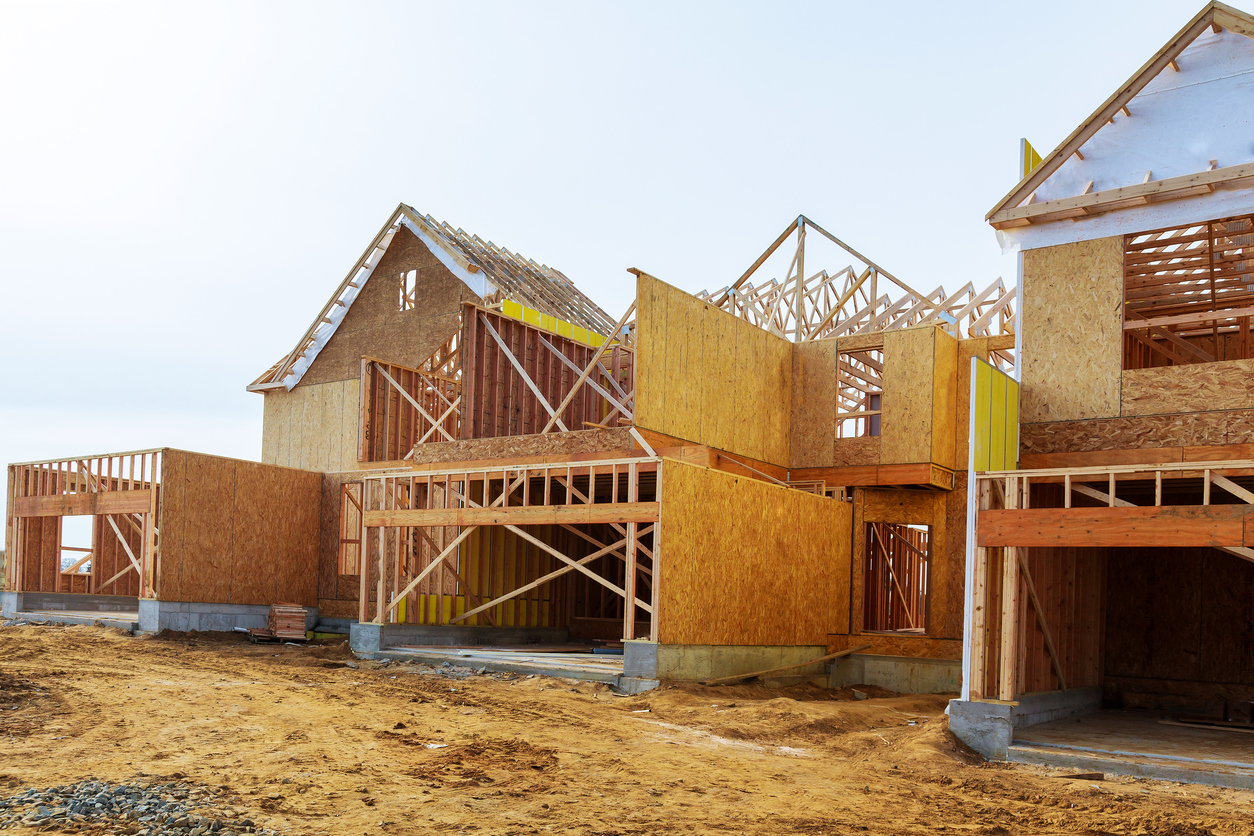
If you have ever thought about owning a new home, the last two months of the year are usually the best time to make that happen.
Here’s why…
Many builders have year-end goals and sales quotas to hit. If they have a “standing inventory” of homes that are completed but not sold, they are typically motivated to sell these homes by the end of the year.
This dynamic can be especially true for publicly-traded builders who are even more motivated to hit year-end sales numbers.
Up and down the Front Range there are beautiful new homes in fantastic neighborhoods. The builders of these homes may be happy to make concessions and provide incentives as long as you close by year-end.
We just recently helped a buyer with a very compelling incentive package from a builder which included a lower price, additional landscaping and window coverings.
If you would like more details about these kinds of opportunities, reach out and we can help.
Most Active

What is the most active price range in Northern Colorado? Take a guess…
- $300,000 to $400,000
- $400,000 to $500,000
- $500,000 to $750,000
- $750,000 and above
By far, the most active price range is $300,000 to $400,000 with 60% more closed transactions than the $400,000 to $500,000 range and 400% more than homes priced $750,000 and above.
However, this lower price range does not have the most inventory. The price range with the greatest selection of homes is $500,000 to $750,000.
Net Worth

It’s no surprise that for just about every homeowner, their real estate represents the largest portion of their net worth.
Check out these numbers from the Federal Reserve’s Survey of Consumer Finances:
- Median Net Worth in the U.S. = $97,300
- Median Net Worth of a Renter = $5,200
- Median Net Worth of a Homeowner = $231,400
If you want to see even more insights about the Colorado market so that you can make really good decisions about your real estate, you are welcome to watch this complimentary webinar, just click HERE.
Reduced

Some fascinating research from the Denver Metro Association of Realtors…
37% of properties that sold last month along the Front Range had a price reduction at some point during the listing period.
Property owners who have to reduce their price take an average of 58 days to receive an offer.
Those who don’t have to reduce their price only take 13 days.
This stat obviously speaks to the importance of pricing your property right on day one.
 Facebook
 X
X
 Pinterest
 Copy Link


