
 Facebook
 X
X
 Pinterest
 Copy Link
Sign Surprise


Given how active our market is today and has been over the last few years, many people assume that virtually every home with a “For Sale” sign in the front yard is already under contract.
They are surprised to learn that, in most cases, the “For Sale” sign does indeed represent a home that is actively for sale.
For example, today in Fort Collins there are 655 single-family homes on the market. 290 of these are under contract and will be closing soon. 365 of these are still active. So, 56% of the signs in Fort Collins are in front of homes that are still available.
Here are the specific numbers for each of our Northern Colorado markets:
• Fort Collins = 56%
• Loveland = 57%
• Windsor = 58%
• Greeley = 41%
Over List


A statistic we keep our eye on is the percentage of homes which sell for at least list price.
In a robust, healthy, market with lower inventory, we will frequently see homes selling for their asking price or even higher.
Here are the number of sales that occur for list price or higher in each of our major markets:
• Fort Collins = 60%
• Loveland = 60%
• Greeley = 71%
• Windsor = 56%
There are a couple of things we notice about these numbers. First, well over half of all sales are for at least list price. This means that a buyer needs to be prepared to make a full price offer (or higher) in most cases. This also means that if a seller is priced right and marketed effectively, they should achieve their asking price.
We also notice that these percentages are lower than one year ago. In 2018 these numbers were 5% to 10% higher in each market. This is good news for buyers of course because the bidding wars are not as intense as last year.
Where Are The Sales?


A high-level look at the Northern Colorado region shows that the number of residential sales is down 5.4% in Larimer County and up 4.7% in Weld County. This is simply comparing the number of closings from June 2018 to June 2019 versus June 2017 to June 2018.
The high-level look doesn’t tell the whole story. It get’s more interesting when we look at individual Northern Colorado cities and towns:
• Fort Collins = -8.8%
• Loveland = -5.7%
• Greeley = +11.7%
• Windsor = +16%
• Wellington = -16.9%
• Timnath = +44.1%
• Severance = +20.4%
• Johnstown = -18.7%
• Berthoud = +18.1%
• Evans = -14.7%
So, what can we learn from this? The areas with increased sales are where there is an abundance of new construction (Timnath and Severance for example).
The areas with decreased sales don’t have an abundance of new construction (Fort Collins for example).
The exceptions to this would be Wellington and Johnstown. It appears that there is price sensitivity to the new construction product now being built in these areas. Given rising costs, builders are challenged to deliver a product under $350,000 in these places.
For instance, in Wellington, between June 2017 and June 2018 there were 137 sales of new homes priced under $350,000. Today there are only 6 new homes on the market at that price point.
New Home News!
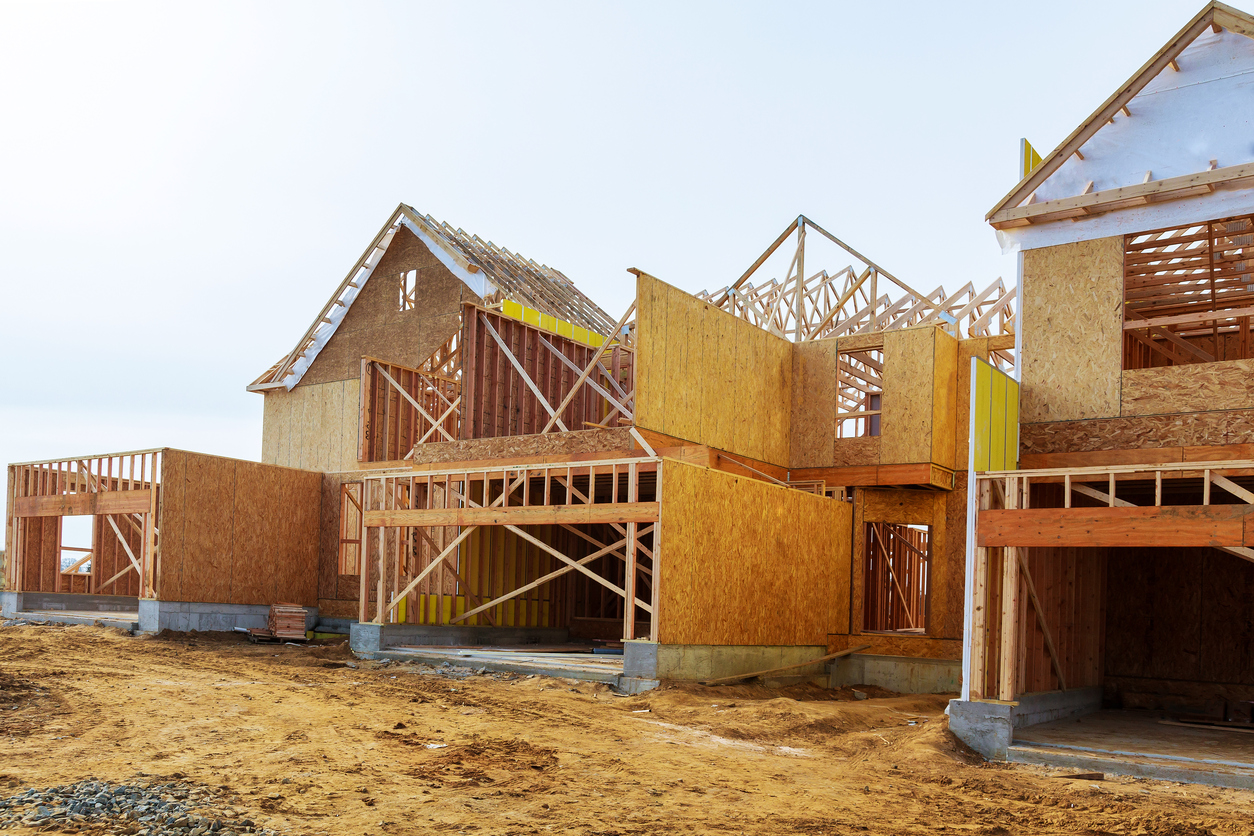

Nationally, sales of new homes are stronger than they have been in a long time. March was the best month since 2007 and April was the third-best month in that same time period.
This research comes from the National Association of Home Builders who show that we are on pace to sell 673,000 new homes this year across the Country. 5 years ago there were roughly 450,000 sales of new homes.
For the first four months of 2019, new home sales are 6.7% ahead of the sales pace of the initial four months of 2018.
What is interesting is that those gains have distinct regional clustering. Year-to-date sales are up 10.3% in the South, 6.7% in the West (concentrated in the Mountain states), and 1.3% in the Midwest, while recording a 17.6% decline in the Northeast.
Down Again
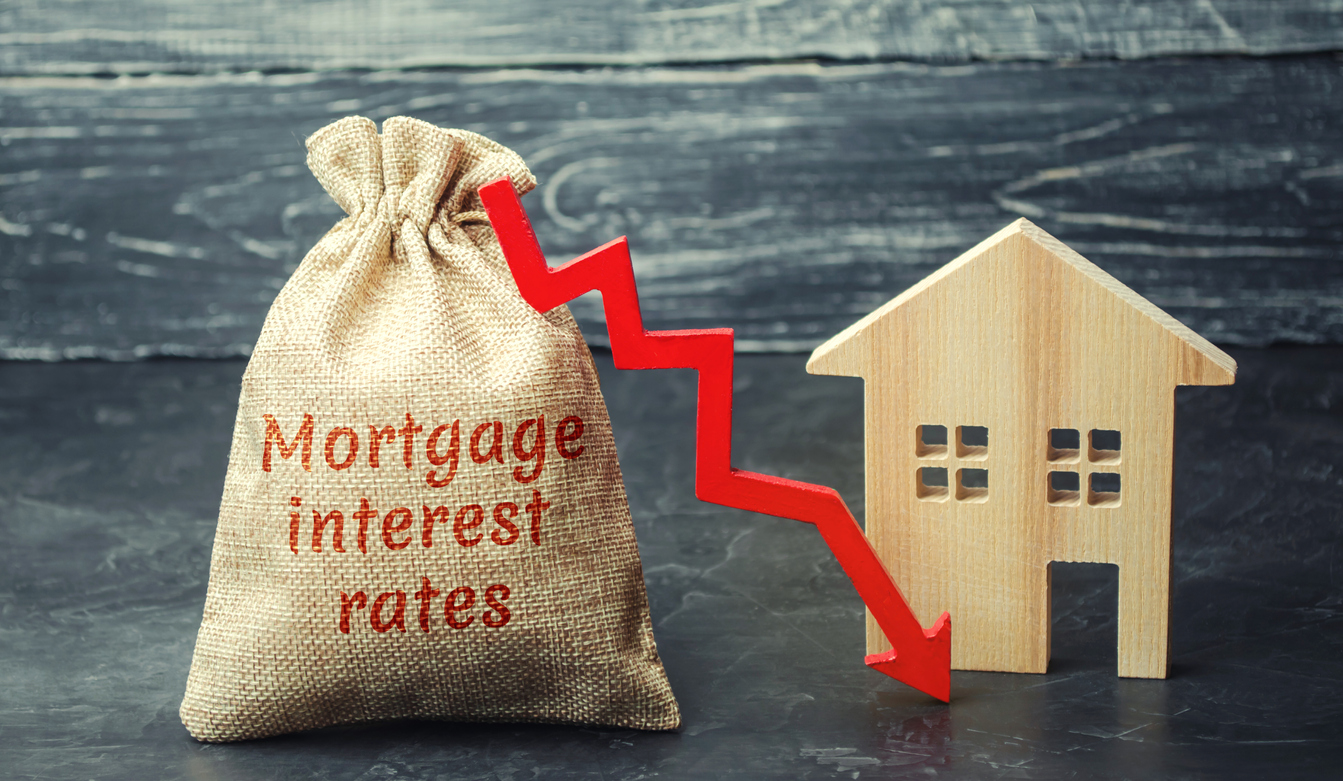
Mortgage rates dropped again for the fourth week in a row.
The average 30-year rate is now 4.06% which is the lowest it has been all year.
Rates today are actually the lowest they have been since early 2018.
The main factor driving rates down is the trade war with China.
Investors are shifting money from stocks into bonds which causes the yield on the 10-year Treasury to drop.
Mortgage rates are closely aligned with the 10-year Treasury.
At the beginning of the year, most experts believed that 2019 would have a trend of increasing mortgage rates eventually reaching 5.5%.
Instead, the opposite has happened which is good news for real estate.

The Question of the Day

As we are helping people understand their new property assessments and putting together information so that they may protest their new valuation, here is the most common question we hear…

Did my property really go up that much?
Here are some stats that will help you answer that question.
First, you need to know that property assessments are done by the County every two years. So, as you look at how much your property increased in value according to the County, keep in mind that this increase is over a two-year period.
Next, it will help you to know how much our markets increased, on average, over the last two years. This data comes from our most trusted source, the Federal Housing Finance Authority.
Two Year Appreciation:
• Metro Denver = 18.65%
• Larimer County = 17.60%
• Weld County = 22.31%
• Boulder County = 16.28%
If you have questions about your new valuation or how to protest your property’s assessment, we would be happy to help. Just reach out and let us know.
Charming 1940’s Ranch Bungalow in Fort Collins
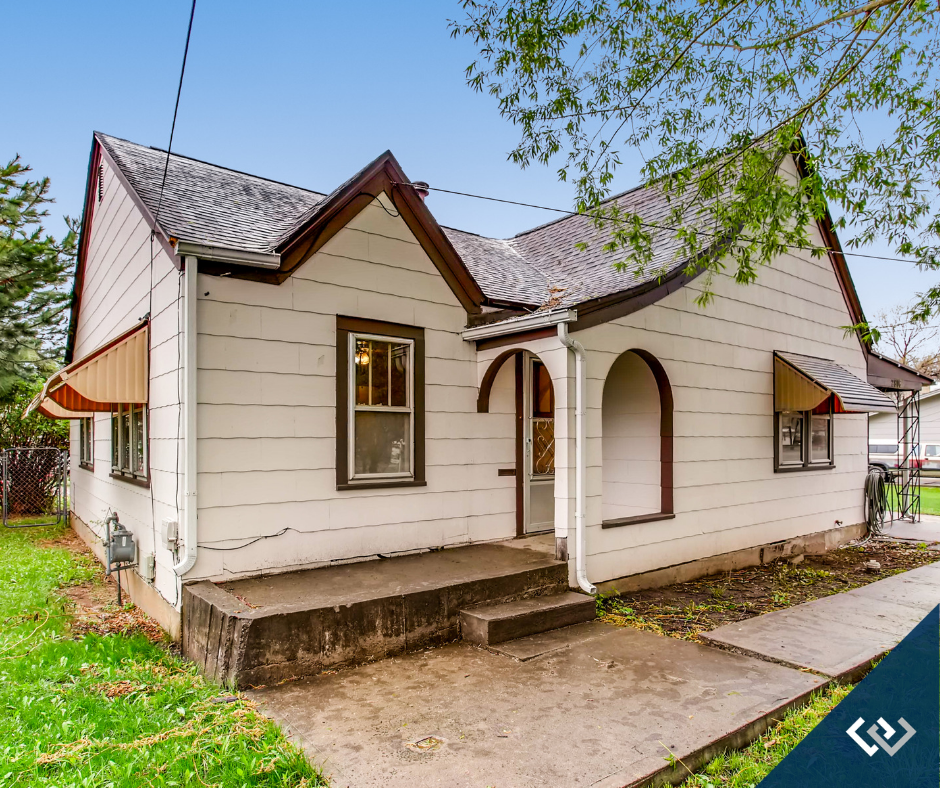
This charming 1940’s ranch bungalow at 2806 Laporte Ave has quaint old town character and has loads of natural light, original hardwood floors throughout, built-in cabinets, large laundry room/mud room. Newer water heater, interior paint, roof and updated electrical. Convenient location with easy access to downtown, City Park, golf course, foothills and the CSU campus. Outside City limits, no HOA. First American Home Warranty included. Contact Kelly Swift for your private showing at (970) 310-4876 for more information or click the link below for more details.
Inventory vs. Sales

A stat we find interesting is the relationship between the inventory for sale versus what is actually selling.
Specifically what we look at are price ranges.
We are curious to know if the inventory that is for sale lines up with what the buyers want.
Here’s what we notice…
In Larimer County, 23% of all the single family homes for sale are priced under $400,000. No surprise, this is a popular price range among buyers and it represents 45% of all sales.
So, the ratio is 23% of the inventory versus 45% of the sales.
In Weld County, the difference is more pronounced.
Homes under $400,000 represent 44% of the inventory and 69% of the sales.
Because the percentage of sales is higher than the percentage of inventory, properties under $400,000 will sell much quicker and are more likely to have multiple offers.
__________________________________________________________________________________________________________
To see the latest on the market, be sure to check out a copy of the new Gardner Report, our Chief Economist’s quarterly look at Front Range real estate.
Amazing Property Opportunity in Timnath!

This home at 4309 Main St features 2 bedrooms on the main floor and 1 nicely updated bathroom. Upstairs has another bedroom and bathroom with a very spacious loft area. Amazing opportunity to own a great piece of property on Main St in Timnath on over a 1/3 acre lot with a 1,400 sq ft garage shop area and easy access to I-25 & Fort Collins. This home is ready for your personal touch and has been pre-inspected for your convenience. Contact Greg Rittner for your private showing at (970) 682-3050 for more information or click the link below for more details.
Colorado Real Estate Market Update

Posted in Colorado Real Estate Market Update by Matthew Gardner, Chief Economist, Windermere Real Estate

The following analysis of the Metro Denver & Northern Colorado real estate market (which now includes Clear Creek, Gilpin, and Park counties) is provided by Windermere Real Estate Chief Economist Matthew Gardner. We hope that this information may assist you with making better-informed real estate decisions. For further information about the housing market in your area, please don’t hesitate to contact your Windermere agent.
ECONOMIC OVERVIEW
Colorado’s economy continues to grow with the addition of 44,800 new non-agricultural jobs over the past 12 months. This represents a reasonable growth rate of 1.7%. As stated in last quarter’s Gardner Report, we continue to see a modest slowdown in employment gains, but that’s to be expected at this stage of the business cycle. I predict that employment growth in Colorado will pick back up as we move through the year, adding a total of 70,000 new jobs in 2019, which represents a growth rate of 2.6%.
In February, the state unemployment rate was 3.7%, up from 2.9% a year ago. The increase is essentially due to labor force growth, which rose by more than 84,000 people over the past year. On a seasonally adjusted basis, unemployment rates in all the markets contained in this report haven’t moved much in the past year, but Boulder saw a modest drop (2.7%), and the balance of the state either remained at the same level as a year ago or rose very modestly.
HOME SALES
- In the first quarter of 2019, 11,164 homes sold — a drop of 3% compared to the first quarter of 2018 and down 13.5% from the fourth quarter of last year. Pending sales in the quarter were a mixed bag. Five counties saw an increase, but five showed signs of slowing.
- The only market that had sales growth was Adams, which rose 4.9%. The rest of the counties contained in this report saw sales decline, with a significant drop in the small Park County area.
- I believe the drop in the number of home sales is partially due to the significant increase in listings (+45.6%), which has given would-be home buyers more choice and less need to act quickly.
- As mentioned above, inventory growth in the quarter was significant, but I continue to believe that the market will see sales rise. I expect the second half of the year to perform better than the first.

HOME PRICES
 Home prices continue to trend higher, but the rate of growth is tapering. The average home price in the region rose just 2.1% year-over-year to $456,243. Home prices were .3% higher than in the fourth quarter of 2018.
- I anticipate that the drop in interest rates early in the year will likely get more buyers off the fence and this will allow prices to rise.
- Appreciation was again strongest in Park County, where prices rose 21.9%. We still attribute this rapid increase to it being a small market. Only Clear Creek County experienced a drop in average home price. Similar to Park County, this is due to it being a very small market, making it more prone to significant swings.
- Affordability remains an issue in many Colorado markets but that may be offset by the drop in interest rates.

DAYS ON MARKET
- The average number of days it took to sell a home in Colorado rose five days compared to the first quarter of 2018.
- The amount of time it took to sell a home dropped in two counties — Gilpin and Park — compared to the first quarter of 2018. The rest of the counties in this report saw days-on-market rise modestly with the exception of the small Clear Creek market, which rose by 26 days.
- In the first quarter of 2019, it took an average of 42 days to sell a home in the region, an increase of four days compared to the final quarter of 2018.
- Job growth drives housing demand, but buyers are faced with more choice and are far less frantic than they were over the past few years. That said, I anticipate the late spring will bring more activity and sales.

CONCLUSIONS
 This speedometer reflects the state of the region’s real estate market using housing inventory, price gains, home sales, interest rates, and larger economic factors.
For the first quarter of 2019, I have moved the needle a little more in favor of buyers. I am watching listing activity closely to see if we get any major bumps above the traditional increase because that may further slow home price growth; however, the trend for 2019 will continue towards a more balanced market.

As Chief Economist for Windermere Real Estate, Matthew Gardner is responsible for analyzing and interpreting economic data and its impact on the real estate market on both a local and national level. Matthew has over 30 years of professional experience both in the U.S. and U.K.
In addition to his day-to-day responsibilities, Matthew sits on the Washington State Governors Council of Economic Advisors; chairs the Board of Trustees at the Washington Center for Real Estate Research at the University of Washington; and is an Advisory Board Member at the Runstad Center for Real Estate Studies at the University of Washington where he also lectures in real estate economics.
