
 Facebook
 Twitter
 Pinterest
 Copy Link
Q2 2021 Colorado Real Estate Market Update

The following analysis of the Metro Denver & Northern Colorado real estate market is provided by Windermere Real Estate Chief Economist Matthew Gardner. We hope that this information may assist you with making better-informed real estate decisions. For further information about the housing market in your area, please don’t hesitate to contact your Windermere Real Estate agent.
REGIONAL ECONOMIC OVERVIEW
Although the post COVID-19 job recovery took a step backward last winter, it has since picked up again, which is very pleasing to see. At the end of the second quarter, the state had recovered more than 276,000 of the 376,000+ jobs that were shed due to COVID-19. Even though employment levels are still almost 100,000 lower than the pre-pandemic peak, they are heading in the right direction. Looking at the markets contained in this report, current employment levels in Colorado Springs are only 2.2% below the pre-pandemic peak, followed by Denver and Fort Collins, which are both down 3.6% from the 2020 peak. I would add that all markets showed jobs continuing to return. With total employment levels rising, the unemployment rate stands at 6.2%, down from the pandemic peak of 12.1%. Regionally, unemployment levels range from a low of 4.8% in Boulder to a high of 6.3% in Grand Junction. COVID-19 infection rates dropped during the quarter, which is certain to lead to employment levels continuing to rise unless we see another significant increase in infection rates due to the rise of new variants across the country.
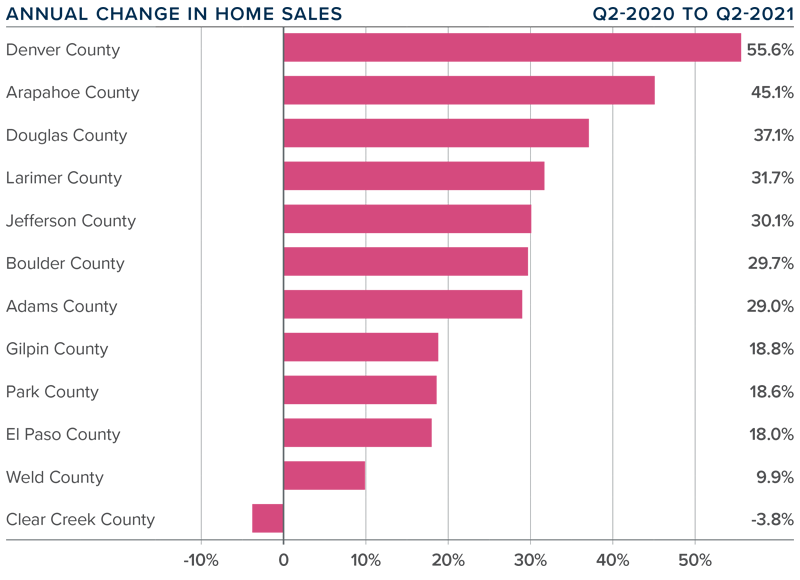
COLORADO HOME SALES
❱ The late spring/early summer market was a good one for home sales, which were up 33.9% from a year ago. Comparing the current quarter to a period when COVID-19 was widespread is not that informative, but, with sales up more than 55% from the first quarter of this year, the market appears to be very buoyant.
❱ Sales were higher in all counties other than the very small Clear Creek County. Where sales rose, they did so at double-digit rates in all markets other than Weld.
❱ During the second quarter, 13,428 homes sold. This is very impressive but not overly surprising, given that the average number of homes for sale was up 45% from the first quarter.
❱ Another positive was that pending sales, which are an indicator of future closings, were 42.8% higher than in the first quarter. This suggests that closings next quarter should be positive as well.
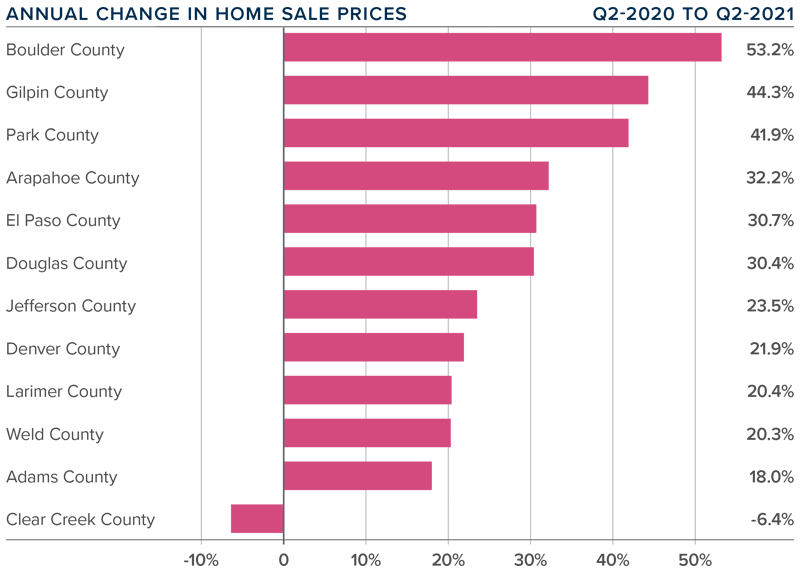
COLORADO HOME PRICES
❱ Prices continue to appreciate at an impressive pace, recording an increase of 28.1% year over year to an average of $615,409. Home prices were also 10.7% higher than the first quarter of this year.
❱ Buyer demand remains very strong, likely exacerbated by the drop in mortgage rates in the second quarter and improving levels of inventory.
❱ Year-over-year, prices rose across all markets covered by this report, with the exception of Clear Creek County. Of the markets that saw prices rise, all did so by double digits, with very notable gains in Boulder, Gilpin, and Park counties.
❱ Affordability levels continue to trouble me, and the pace of price appreciation has to slow at some point. The market is clearly still out of balance, but as long as the credit quality of buyers remains high, I do not see any cause for concern.
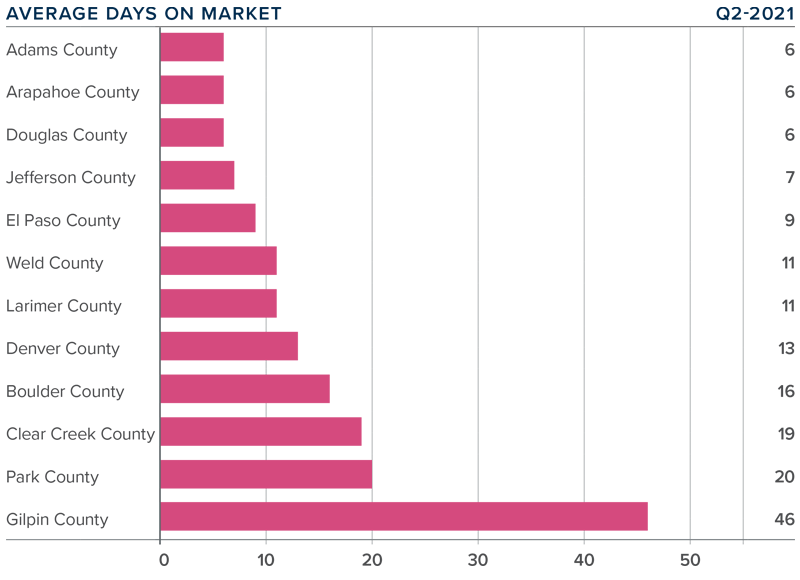
DAYS ON MARKET
❱ The average number of days it took to sell a home in the markets contained in this report dropped 14 days compared to the second quarter of 2020.
❱ The amount of time it took to sell a home dropped in every county contained in this report compared to the second quarter of 2020. The exception was Gilpin County, where it rose by only two days.
❱ It took an average of only 14 days to sell a home in the region, which is down 11 days compared to the first quarter of this year.
❱ The Colorado housing market remains very tight, as demonstrated by the fact that it took less than a month for homes to sell in every county other than one.
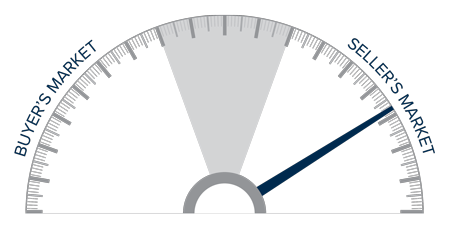
CONCLUSIONS

This speedometer reflects the state of the region’s real estate market using housing inventory, price gains, home sales, interest rates, and larger economic factors.
Sales rose on the back of lower mortgage rates and higher levels of homes available to buy. Although this should signify a move back to a more balanced market, we are not there yet as price growth remains well above the long-term average.
With solid demand and favorable financing rates, the market is expected to remain active as we move through the balance of the year. That said, housing affordability is becoming an increasingly large concern. According to the Colorado Association of REALTORS®, statewide affordability for single-family homes has dropped almost 20% year-over-year and is down 17.8% for multi-family homes.
At some point, an affordability ceiling will be reached, which will slow home-price appreciation—but not yet. As such, I am moving the needle a little more in favor of home sellers, as they remain in the driver’s seat, for now.
ABOUT MATTHEW GARDNER

As Chief Economist for Windermere Real Estate, Matthew Gardner is responsible for analyzing and interpreting economic data and its impact on the real estate market on both a local and national level. Matthew has over 30 years of professional experience both in the U.S. and U.K.
In addition to his day-to-day responsibilities, Matthew sits on the Washington State Governors Council of Economic Advisors; chairs the Board of Trustees at the Washington Center for Real Estate Research at the University of Washington; and is an Advisory Board Member at the Runstad Center for Real Estate Studies at the University of Washington where he also lectures in real estate economics.
What is a Seller’s Market?

When the housing market favors sellers, a seller can expect ideal conditions for selling their home. However, that’s not to say that a seller’s market doesn’t come with its own unique set of challenges for parties on both sides of the transaction. That’s why it’s critical for buyers and sellers to work with an agent who not only understands their wants and needs but who can also help them navigate highly competitive market conditions.
What is a Seller’s Market?
A seller’s market occurs when demand exceeds supply. When inventory is limited, competition amongst buyers is fierce. Median sales prices increase, days on market decrease, and homes commonly receive multiple offers, often over their original asking price.
Selling in a Seller’s Market
Though demand is high in a seller’s market, staging and making any necessary repairs are still important steps to take before hitting the market. An agent can help a seller make important decisions about which repairs and updates help add value to the home.
When it comes to offers and negotiations in a seller’s market, sellers have the leverage. It’s common for homes to fetch more than their asking price with multiple offers on the table. Though prices are being driven up by demand, a seller may choose to list their home at or just below fair market value with the hopes of starting a bidding war. Because competition is so high, buyers may be willing to waive an inspection contingency to help make their offer stand out. Agents can help sellers decide whether they should conduct a pre-listing inspection, which sometimes helps the seller get more offers and command a higher price.
With multiple offers on the table, it may be tempting to simply choose the one with the highest figure; however, the best offer is also the one that removes risk and aligns with the seller’s goals. Whether that entails waived contingencies, a shorter closing window, or an all-cash offer, in a seller’s market, the seller has the power to choose. Sellers should fully review each offer with the help of their agent before proceeding.
Buying in a Seller’s Market
Buyers in a seller’s market must act fast. Due to the high level of competition, they must be prepared for a frustrating scenario where their offers may not win out. This emphasizes the importance of working with a buyer’s agent. In a seller’s market, it’s more likely that the buying process will include such factors as seller review dates and escalation clauses. A buyer’s agent will help navigate these challenges while working with their client to make their offer stand out. They will formulate a strategy, comparing their client’s wish list and budget against the limited number of homes available and proceeding accordingly. A buyer’s agent will also set the expectation that, due to the competitive nature of the market, finding the right home may take longer than expected.
In a seller’s market, the buyer is at a disadvantage when it comes to negotiations. The chance of getting a contingent offer is minimal and pushing for certain closing dates and specific repairs may do more harm than good to their offer. A cash offer has significant power in a seller’s market. If a buyer can make a cash-heavy or even all-cash offer, it is likely to stand out to the seller. It gives the buyer more buying power and greatly increases their chances of winning a bidding war.
For more information on the conditions of your local market, visit our website for Quarterly Real Estate Market Updates from our Chief Economist, Matthew Gardner. For assistance planning a home sale or purchase, connect with a Windermere Real Estate agent here: Connect With an Agent
Q1 2021 Colorado Real Estate Market Update

The following analysis of the Metro Denver & Northern Colorado real estate market is provided by Windermere Real Estate Chief Economist Matthew Gardner. We hope that this information may assist you with making better-informed real estate decisions. For further information about the housing market in your area, please don’t hesitate to contact your Windermere Real Estate agent.
REGIONAL ECONOMIC OVERVIEW
Following the decline in employment last winter, Colorado has started to add jobs back into its economy. The latest data shows that the state has now recovered more than 219,000 of the 376,000+ jobs that were lost due to COVID-19. This is certainly positive, but there is a long way to go to get back to pre-pandemic employment levels. Denver and Fort Collins continue to have the greatest improvement in employment, but all markets show job levels well below pre-pandemic levels. With total employment levels rising, the unemployment rate stands at 6.6%, down from the pandemic peak of 12.1%. Regionally, unemployment levels range from a low of 5.6% in Fort Collins and Boulder to a high of 6.7% in Greeley. COVID-19 infection rates have started to increase again, and this has the potential to negatively impact the job market. I am hopeful that the state will not be forced to pull back reopening, but this is certainly not assured.
COLORADO HOME SALES
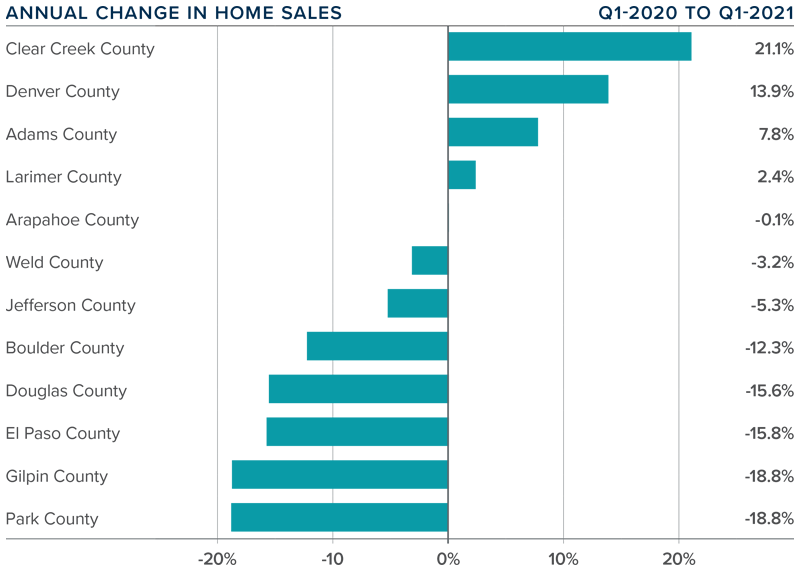
❱ 2021 started off on a bit of a sour note, with total sales down 1.2% compared to the same period in 2020. Sales were 29.2% lower than in the final quarter of 2020 as 8,645 homes sold.
❱ Sales were higher in four of the counties contained in this report, were essentially flat in one, and dropped in seven. It was pleasing to see significant sales growth in the large counties of Denver and Adams.
❱ Another positive was that pending sales, which are an indicator of future closings, were 4.8% higher than in the fourth quarter of 2020 and 5% higher than a year ago.
❱ The disappointing number of home sales overall can primarily be attributed to the woeful lack of inventory. Listings in the quarter were down more than 61% year over year and were 40.6% lower than in the fourth quarter of 2020.
COLORADO HOME PRICES
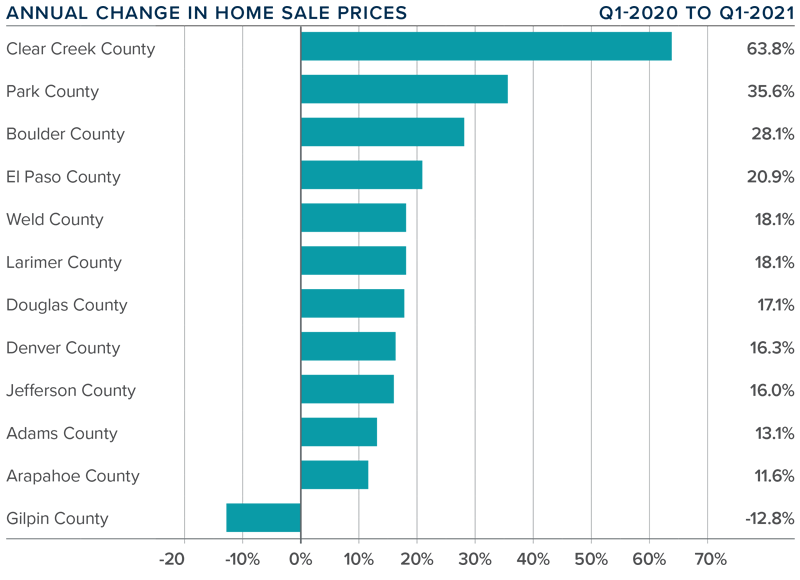
❱ Prices continue to appreciate at a very rapid pace, with the average sale price up 16.5% year over year, to an average of $556,100. Home prices were also 4.4% higher than in the fourth quarter of 2020.
❱ Buyers appear to be out in force, and this demand—in concert with very low levels of inventory—continues to heat the market.
❱ Prices rose over last year across all markets covered by this report, with the exception of the very small Gilpin County. All other counties saw sizeable gains and the trend of double-digit price growth continued unabated.
❱ Affordability levels are becoming a greater concern as prices rise at a far faster pace than wages. Even though mortgage rates have started to rise, they haven’t yet reached the level needed to take some of the heat out of the market.
DAYS ON MARKET
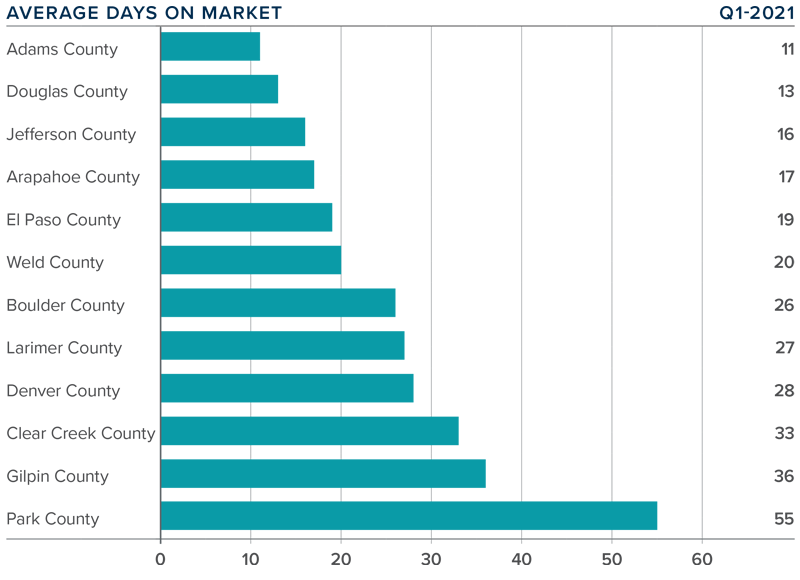
❱ The average time it took to sell a home in the markets contained in this report dropped 20 days compared to the first quarter of 2020.
❱ The amount of time it took to sell a home dropped in every county contained in this report compared to the fourth quarter of 2020.
❱ It took an average of 25 days to sell a home in the region, down one day from the fourth quarter of 2020.
❱ The Colorado housing market remains very tight, as demonstrated by the fact that it took less than a month for homes to sell in all but two counties.
CONCLUSIONS
This speedometer reflects the state of the region’s real estate market using housing inventory, price gains, home sales, interest rates, and larger economic factors.
The relatively low level of home sales is not a surprise given how few choices there are for buyers. Sellers are certainly benefitting from strong demand, as demonstrated by the significant price growth. I maintain my belief that there will be an increase in inventory as we move through the year, but it is highly unlikely that we will see a balanced market in 2021.
Given these factors, I am moving the needle a little more in favor of sellers, as demand is likely to continue to exceed supply.
ABOUT MATTHEW GARDNER

As Chief Economist for Windermere Real Estate, Matthew Gardner is responsible for analyzing and interpreting economic data and its impact on the real estate market on both a local and national level. Matthew has over 30 years of professional experience both in the U.S. and U.K.
In addition to his day-to-day responsibilities, Matthew sits on the Washington State Governors Council of Economic Advisors; chairs the Board of Trustees at the Washington Center for Real Estate Research at the University of Washington; and is an Advisory Board Member at the Runstad Center for Real Estate Studies at the University of Washington where he also lectures in real estate economics.
At Least List

Periodically we track a stat which we find to be quite interesting.
It answers this question – how many properties are selling for at least list price (asking price or higher)?
This stat tells us how active the market is and helps our buyers to realize that, in some cases, they will be in a competitive situation.
When we look at single-family home sales so far this month, this is what we find:
- 57% of properties in Larimer County sell for at least list price
- 62% of properties in Weld County sell for at least list price
So, in well over half of the transactions, buyers need to offer list price or higher to acquire the property.
The data gets even more interesting when this information is broken out by price range.
To no one’s surprise, the percentage increases for properties priced under $400,000:
- 81% in Larimer County
- 70% in Weld County
We find that for properties over $400,000 the percentages still tell a story of a very active market:
- 47% in Larimer County
- 56% in Weld County
Bottom line, in most locations and price ranges we see a strong sellers’ market where buyers need to be prepared to make a strong offer and to also compete.
More Homes Needed

The market is in short supply.
More homes are needed to fulfill the need to buyer demand.
Compared to exactly one year ago, the supply of homes is down:
- 32.6% in Metro Denver
- 25.1% in Northern Colorado
An interesting and useful measurement we track is months of inventory. This stat tells how long it would take to sell all of the homes currently for sale at the current pace of sales.
Of course, months of supply can vary greatly by price range and location. However, this stat does a good job of explaining the overall state of the market.
Specifically, months of supply tells us if the market is in balance.
A ‘balanced’ market is when there is 4 to 6 months of supply. A buyers market occurs when the stat is higher than this range. A sellers market occurs when it is lower.
The months of supply looks like this in our market:
- 1.0 months in Metro Denver
- 1.3 months in Northern Colorado
So, the market overall is significantly under-supplied and more homes are needed to meet demand.
Which Market?

So, which is it? A buyer’s market or a seller’s market?
Well, it depends!
First, let’s define each market. According to research, a buyer’s market exists when there is more than 4-6 months of inventory on the market.
If it would take longer than 4-6 months to sell out all of the inventory currently for sale, then it is a buyer’s market.
This calculation is obviously a function of the amount of inventory on the market and the current pace of sales.
A seller’s market exists if it would take shorter than 4-6 months.
So, which is it?
It depends very much on the price range.
Here are the numbers for Northern Colorado:
• $300,000 to $400,000 = 0.9 months
• $400,000 to $500,000 = 1.9 months
• $500,000 to $750,000 = 2.3 months
• $750,000 and over = 5.8 months
So, most price ranges are a clear seller’s market. It’s not until $750,000 and over that the market starts to approach a more balanced state.
Here’s one more thing that might help you…
You probably don’t need a reminder that this is tax season.
Not only because tax returns are due in two weeks but also because you will soon receive your property tax notification in the mail.
Every two years your County re-assesses the value of your property and then sends that new value to you.
When this happens, many of our clients:
- Don’t agree with the new assessed value
- Aren’t sure what to do
- Are confused by the process
- Want to save money on property taxes
Good news! We have a webinar that will help you. On the webinar we will show you:
- How to read the information from the County
- What it means for you
- How to protest the valuation if you want
- How to get an accurate estimate of your property’s value
You can listen to the webinar live or get the recording. In any case, you can sign up at www.WindermereWorkshop.com
The webinar is April 17th at 10:00. If you can’t join live, go ahead and register so you can automatically receive the recording.
This is a complimentary online workshop for all of our clients. We hope you can join!
18 Days

We now measure inventory levels in terms of days.
Typically we measure in months. For instance, a “balanced market” is when there is 4 to 6 months of inventory currently for sale. Meaning that, in a balanced market, it would take 4 to 6 months to sell every home that is currently on the market.
Anything less than 4 months is a seller’s market. Certainly, when we measure in days, we are in an extreme seller’s market.
Today the Greeley market has 18 days of inventory, Fort Collins has 27 days, Loveland has 30, and Windsor has 51.
These are all lower than a year ago. For example, Greeley at this time last year had 27 days of inventory.
But this statistic can be misleading. Sometimes people assume that the extreme seller’s market applies to all price ranges and all locations.
Not true. When we drill down we find sub-patterns that are revealing. For example, homes in Loveland priced over $500,000 have 3 months of inventory and homes in Fort Collins over $750,000 have 5 months.
Because inventory levels tend to increase as prices increase, there becomes a distinct advantage for the move-up buyer. Today, many people can sell in an extreme seller’s market and move up to a price range with less competition and more selection.
Perspectives: Buyer Fatigue


Buyer fatigue. It’s a very real thing and we’re seeing it in cities all up and down the West Coast. What’s causing it? Intensely competitive market conditions in which bidding wars and properties selling for significantly more than asking price are the norm. It’s tiring for buyers. It’s tiring for agents. And it’s emotionally draining when you continue to find, and then lose, the perfect home over and over again.
We recently received a letter from a buyer detailing their experience of bidding on and losing home after home. Eventually they were successful but they wanted us to know that they couldn’t have done it without their agent. Not just the winning offer, but the grueling process it took to get there. They felt that their agent provided the perfect balance of emotional support and professional expertise that they needed to stick with it and eventually find a great home.
For us, this really underscored the importance of having a well-trained agent who not only understands how to compete in a seller’s market, but also truly cares about their clients and the outcome. This market isn’t for the faint of heart, so to be successful you have to be determined yet patient, and you need an agent who will put together specific strategies to help you achieve your goals. It requires total transparency and, at times, brutal honesty.
We wish we could tell you that we’re going to return to a balanced market by the end of the year, but unfortunately that’s highly unlikely. So, if you’re already out there, stay strong. There’s a lot of pressure to overpay for homes right now, so be sure to consult with your agent about the best course of action for your situation. If you’re thinking about jumping in, we can’t stress enough how important it is to work with an agent who will help you successfully navigate the rough waters of this unpredictable housing market.
Six Key Factors That Affect the Sales Price of Your Home


Pricing a home for sale is not nearly as simple as most people think. You can’t base the price on what the house down the street sold for. You can’t depend on tax assessments. Even automatic valuation methods (AVMs), while useful for a rough estimate of value, are unreliable for purposes of pricing a home for sale.
AVMs, like those used by Zillow and Eppraisal, have been used for many years by banks for appraisal purposes. They are derived from algorithms based on past sales. But producers of AVMs agree that they are not accurate indicators of home value. For example, Zillow.com states, “Our data sources may be incomplete or incorrect; also, we have not physically inspected a specific home. Remember, the Zestimate is a starting point and does not consider all the market intricacies that can determine the actual price a house will sell for. It is not an appraisal.”
So what does Zillow recommend sellers do instead? The same thing the real estate industry has been advising for decades: Ask a real estate agent who knows your neighborhood to provide you with a comparative market analysis. To accomplish that, I typically consider the following factors—plus others, depending on the house:
Location
The location of your home will have the biggest impact on how much it can sell for. Identical homes located just blocks apart can fetch significantly different prices based on location-specific conditions unique to each, including: traffic, freeway-access, noise, crime, sun exposure, views, parking, neighboring homes, vacant lots, foreclosures, the number of surrounding rentals, access to quality schools, parks, shops, restaurants and more.
Recommendation: Be willing to price your house for less if it’s located in a less desirable area or near a neighborhood nuisance.
Market
Another major factor that also can’t be controlled is your local housing market (which could be quite different from the national, state or city housing markets). If there are few other homes on the market in your local area (a situation known as a “sellers market”), you may be able to set a higher price. However, if there’s a surplus of homes like yours for sale (a “buyer’s market”), your pricing will also reflect that.
Recommendation: If it’s a buyer’s market and you can delay selling your home until things change, you should consider doing so. If you can’t wait, be willing to price your home extremely competitively, especially if you are in a hurry to sell.
Condition
The majority of buyers are not looking to purchase fixer-uppers, which is why any deferred maintenance and repair issues can also significantly impact the selling price of your home. When your home’s condition is different than the average condition of homes in your location, AVMs tend to produce the widest range of error.
Recommendation: Hire a professional home inspector to provide you with a full, written report of everything that needs upgrading, maintenance or repair, then work with your real estate agent to prioritize the list and decide what items are worth completing before the property is listed for sale, and what should be addressed through a lower list price. Also, some defects are best addressed during negotiations with buyers.
Widespread appeal
If you want to sell your home quickly and for the most money, you have to make it as appealing as possible to the largest pool of prospective buyers. The more universally attractive it is, the greater the interest and the faster competing offers will come.
Recommendation:
Hire a professional home stager (not a decorator) to temporarily stage the interior of your home. Also spend time making the exterior look its best: address any peeling paint, make sure the front door/ door hardware is attractive, prune bushes and trees, remove old play equipment and outdoor structures, etc.
Compare homes
The only neighboring homes that should be used to estimate the value of your home are those that have been carefully selected by a real estate professional with special training, access to all sales records, and in-depth knowledge of the neighborhood.
Recommendation: If you’re considering selling your home, ask your real estate agent to recommend a professional appraiser.
Searchability
When working with a prospective buyer, most real estate agents will search the available inventory only for the homes priced at (or less than) their client’s maximum, which is typically a round number. If your home is priced slightly above or below that amount (e.g., $510,000 or $495,000), it will appear in fewer buyer searches.
Recommendation: Be willing to adjust your selling price to maximize visibility.
Periodic price adjustments
Pricing a home isn’t a set-it-and-forget-it proposal. As with any strategy, you need to be prepared to adapt to fast-changing market conditions, new competition, a lack of offers and other outside factors.
Recommendation: After listing your house, be ready to adjust your asking price, if necessary.
Colorado Real Estate Market Update


ECONOMIC OVERVIEW
Colorado added 45,800 non-agricultural jobs over the past 12 months, a growth rate of 1.8%. Within the metropolitan market areas included in this report, annual employment growth was seen in all areas other than Grand Junction (where employment was stable) with substantial growth seen in Fort Collins (4.6%) and Greeley (3.5%).
In August, the unemployment rate in the state was 2.2%, down from 3.1% a year ago. The lowest reported unemployment rates were again seen in Fort Collins at just 1.8%. The highest rate was in Grand Junction, at a very respectable 3.0%. It is still reasonable to assume that all the markets contained within this report will see above-average wage growth given the very tight labor market.
HOME SALES ACTIVITY
- There were 17,140 home sales during the third quarter of 2017, which was a drop of 3.3% from the same period in 2016.
- Sales rose the fastest in Boulder County, which saw sales grow 4% more than the third quarter of 2016. There were marginal increases in Weld and Larimer Counties. Sales fell in all the other counties contained within this report.
- Home sales slowed due to very low levels of available inventory. Listing activity continues to trend at well below historic averages, with the total number of homes for sale in the third quarter 5.5% below the level seen a year ago.
- The takeaway here is that sales growth has stalled due to the lack of homes for sale.

HOME PRICES

- With substantial competition for the few available homes, prices continue to rise. Average prices were up 7.5% year-over-year to a regional average of $428,602.
- Slower appreciation in home values was again seen in Boulder County, but the trend is still positive.
- Appreciation was strongest in Weld County, which saw prices rise 12%.
- Due to an ongoing imbalance between supply and demand, home prices will continue to appreciate at above-average rates for the foreseeable future.

DAYS ON MARKET
- The average number of days it took to sell a home dropped by one day when compared to the third quarter of 2016.
- Homes in all counties contained in this report took less than a month to sell. Adams County continues to stand out as it took an average of just two weeks to sell a home there.
- During the third quarter, it took an average of 20 days to sell a home. This is up by 3 days compared to the second quarter of this year.
- Demand remains strong, and well-positioned, well-priced homes continue to sell very quickly.

CONCLUSIONS
 This speedometer reflects the state of the region’s housing market using housing inventory, price gains, home sales, interest rates, and larger economic factors.
In the third quarter of 2017, I have chosen to leave the needle where it was in the second quarter. Homes are still scarce; however, there is a small slowdown in price growth and a decline in both closed and pending sales. This may suggest the market is either getting weary of all the competition or that would-be buyers are possibly putting off buying until they see more choices in the number of homes for sale.

Matthew Gardner is the Chief Economist for Windermere Real Estate, specializing in residential market analysis, commercial/industrial market analysis, financial analysis, and land use and regional economics. He is the former Principal of Gardner Economics, and has more than 30 years of professional experience both in the U.S. and U.K.
If you are in the market to buy or sell, we can connect you with an experienced agent here.
