
 Facebook
 X
X
 Pinterest
 Copy Link
107 Straight

According to research from the National Association of Realtors, home prices have appreciated for 107 straight months.
The median price in the U.S. is now $309,000.
The U.S. region with the highest median price is the West at $461,800. The lowest is in the South at $263,300.
All regions showed double-digit price appreciation from one year ago.
While prices are going up all across the U.S., inventory is going down. The number of properties for sale has declined for 20 straight months.
Low inventory and high demand are causing properties to sell quickly. It now takes an average of 21 days for a property to go under contract compared to 43 days one year ago.
So, the dynamics we notice locally are also occurring nationally.
Days of Inventory

In the residential real estate industry, inventory is typically measured in months.
For example, the definition of a “sellers’ market” is when there is less than 4 months of inventory on the market. Meaning, at the current pace of sales, it would take less than four months to sell all the homes currently for sale.
Today it makes more sense to measure inventory in days instead of months.
Here is the number of residential properties currently listed for sale in each market:
- Larimer County = 255
- Weld County = 261
- Metro Denver = 1,645
Here is the current pace of sales in each market:
- Larimer County = 10/day
- Weld County = 10/day
- Metro Denver = 112/day
So, at the current pace of sales, this is how long it would take to sell all the residential properties currently for sale in each market:
- Larimer County = 26 days
- Weld County = 27 days
Metro Denver = 15 days

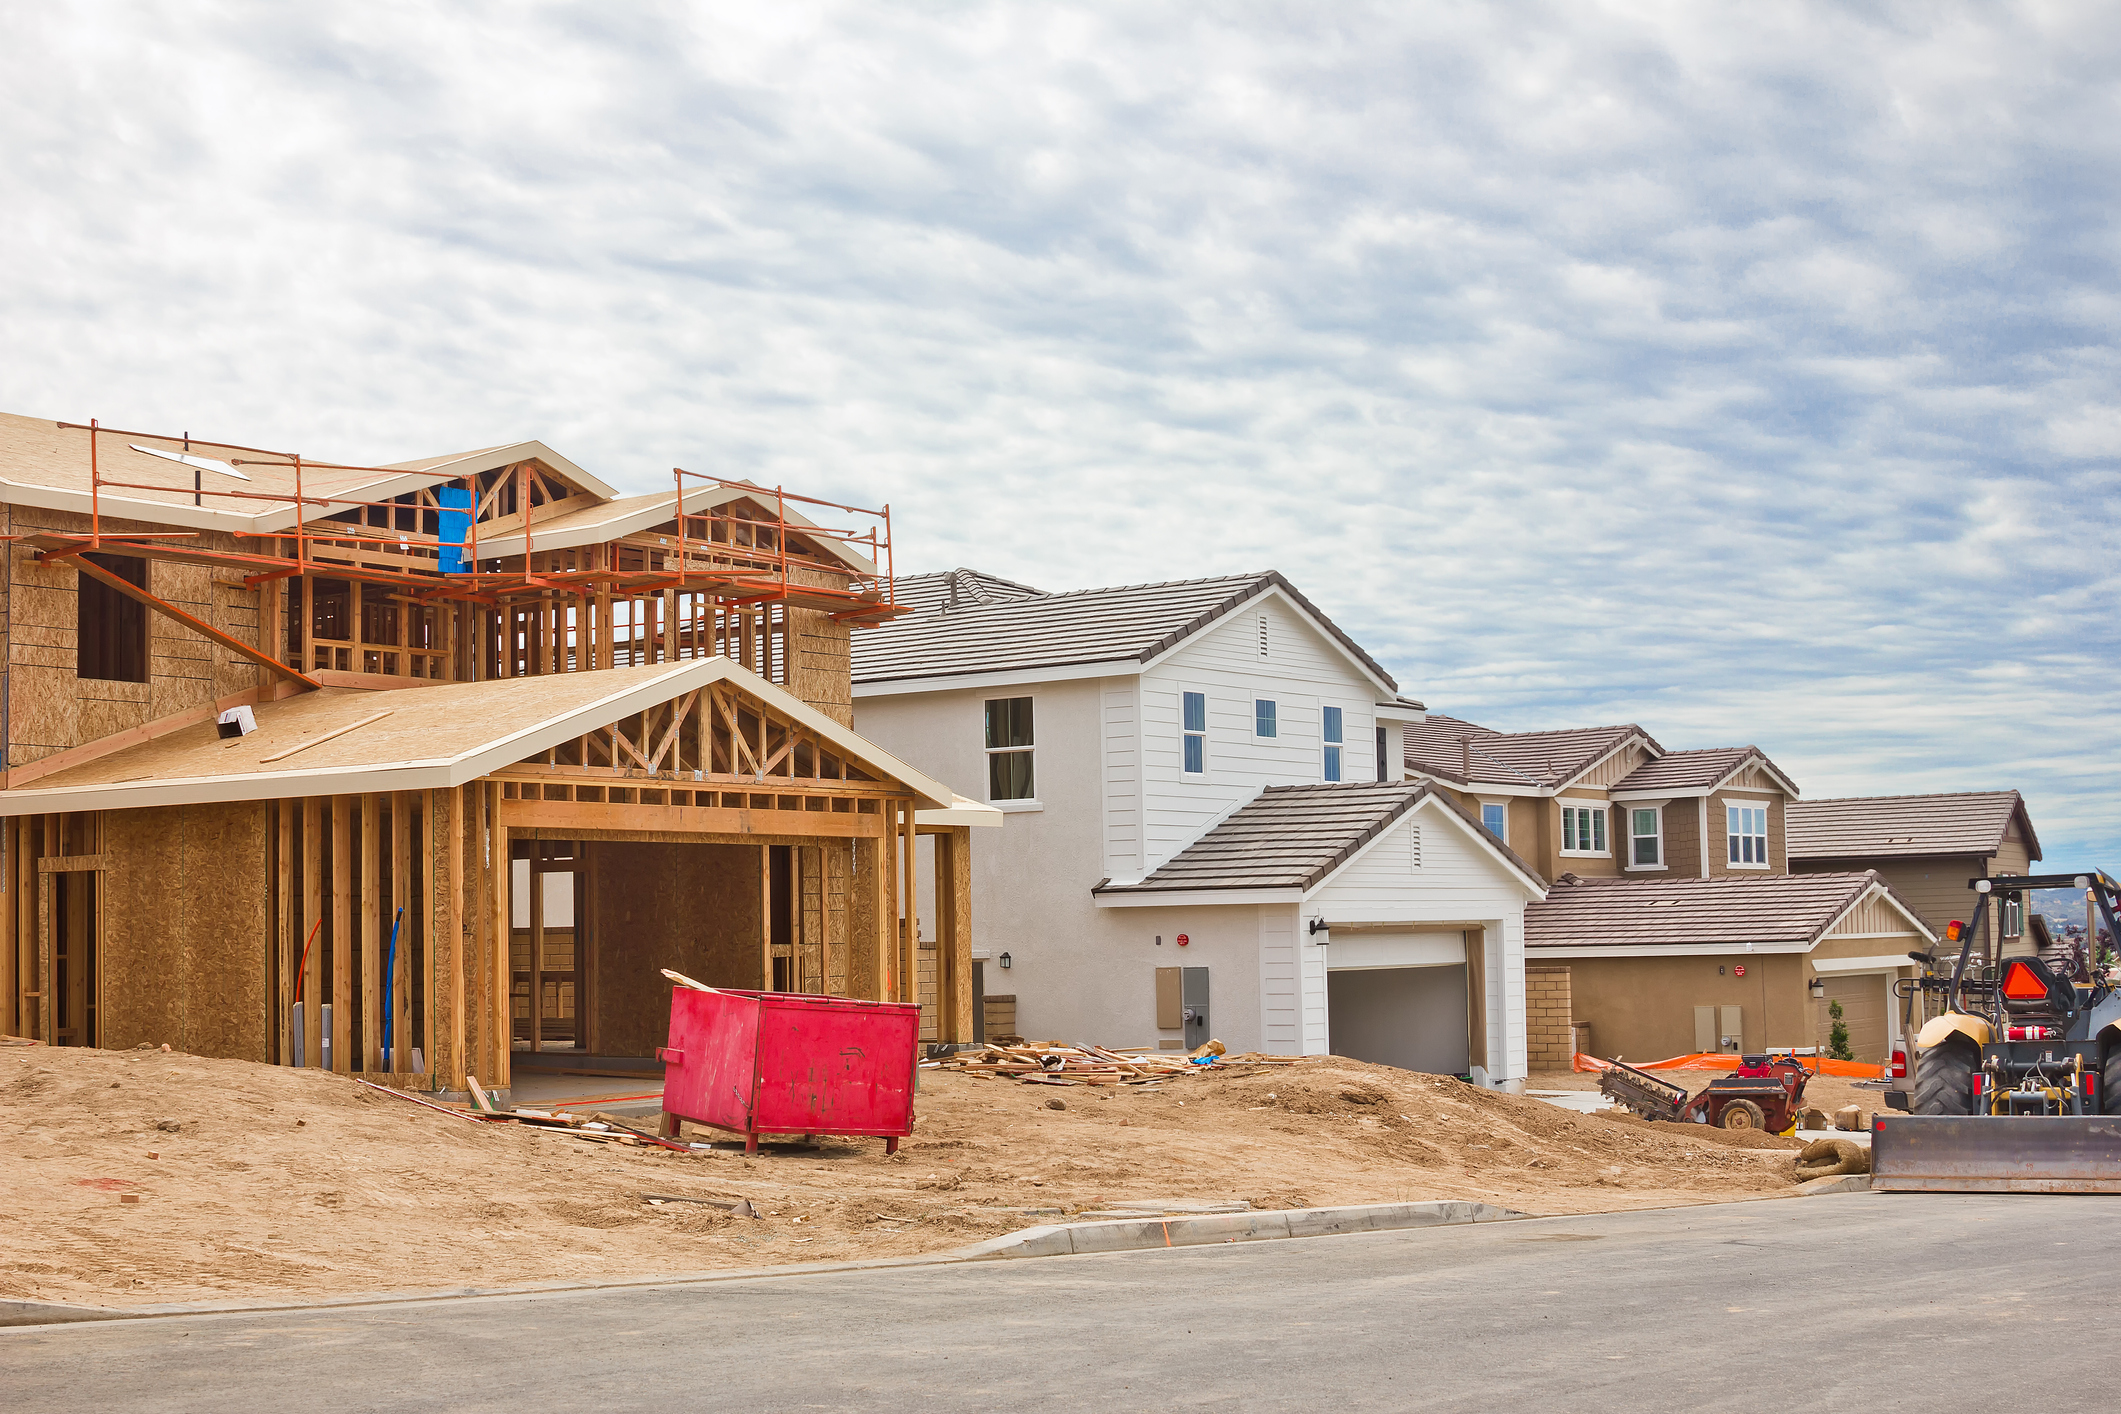
Double Lumber
The price of lumber has doubled in three months.
Lumber is just one of several examples of skyrocketing materials costs which are impacting both home builders and home buyers.
The cost of lumber is now at a record-level $1000 per 1000 board feet.
These rising costs not only add to the sales price of a home but also add to the inventory shortage issue. Some large, publicly-traded home building companies are slowing production in hopes of building costs dropping over the next few months.
Many people expected lumber prices to drop, or at least level off, when the tariff on Canadian lumber changed in December.
However, because demand has been so high from both building and remodeling, lumber costs continue to climb.

Yes is the Answer

It turns out that ‘yes’ is the answer to the most common questions we hear right now about the market…
Do you think more properties will come on the market this Spring? Yes, the normal pattern in our market is for new listings to be 40% to 70% higher in April versus January. The peak month for new listings is typically June.
Do you think buyer demand will grow even more as time goes on? Yes, for two main reasons. Buyer activity, just like listing activity, increases significantly in the Spring and Summer. Plus, we expect the economy to open up even more as the COVID vaccine gets rolled out over the course of the year.
Do you think interest rates will go up? Yes, all of the trusted forecasters and economists expect rates to be slightly higher by the end of the year. Our own Chief Economist sees rates at 3.07% by year-end.
Do you think prices will keep rising? Yes, because of the simple economic forces of supply and demand. Supply is at historic lows. The number of properties for sale today is roughly 80% below the average. Demand is being fueled not only by the low-interest rates, but also a rebounding local job market that is poised to rebound even more. Plus, the new work-from-home dynamic positions the Front Range as a sought after place to live.
A Little Perspective


Here’s a little perspective on the inventory of homes for sale in today’s market…
First we’ll look at Metro Denver:
- The average number of residential listings for sale at this time of year is 15,577
- The highest-ever for this time of year is 29,722 which occurred in 2006
- The number of listings right now is 4,821
- So, inventory in Metro Denver is roughly one-third of the average and 25,000 fewer than the highest-ever.
- DMAR is the source of the stats listed above
Now, Northern Colorado:
- Larimer County has 802 active listings today
- Based on 10 years of data, this is the lowest it has ever been
- The high in Larimer County occurred in 2010 with 2608 listings so today’s inventory is one-third of what it was 10 years ago.
- Inventory today in Weld County is 727 which isn’t the lowest-ever.
- The lowest during the last 10 years was 2017.
The highest was 2010 with 1791 properties so today there are roughly 1,000 fewer properties to choose from.
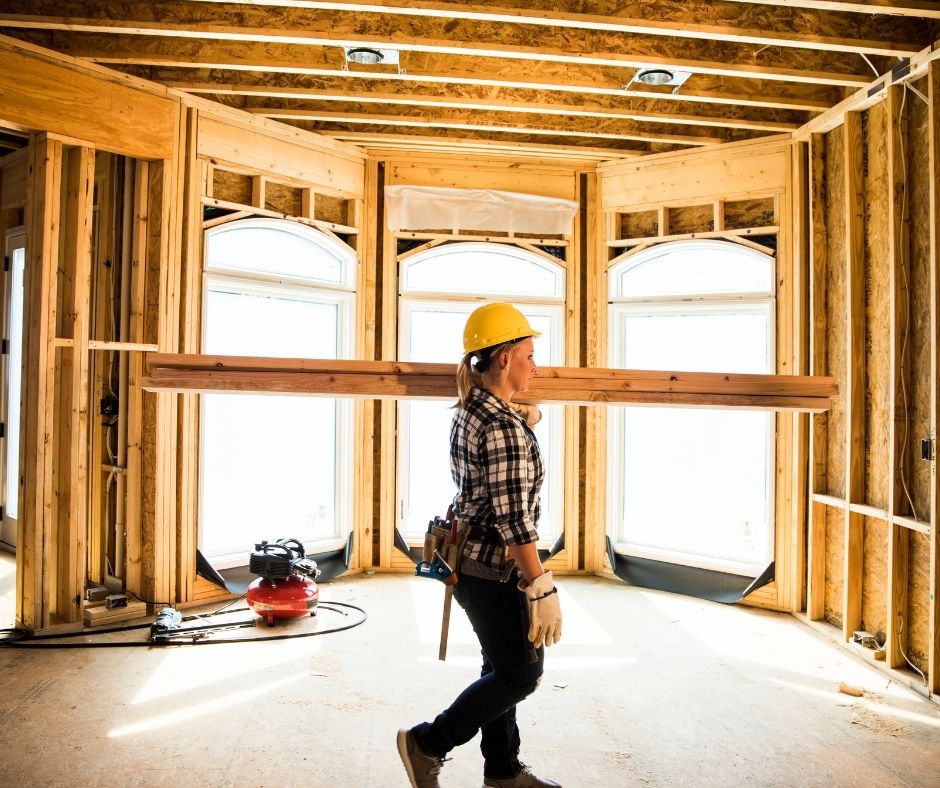
New Home Surge
Sales of new homes have jumped to their highest levels in 14 years.
The annualized rate of single-family new construction homes is now at 901,000 according to the new Census Bureau report.
This means that across the U.S., at the current pace of sales, there will be almost 1,000,000 new homes built and sold over the next 12 months.
This pace is 36% higher than one year ago and the highest it has been since the end of 2006.
Given the low inventory levels of previously-owned homes that most of the Country is experiencing, this uptick in new home activity is welcome news.

More Homes Needed

The market is in short supply.
More homes are needed to fulfill the need to buyer demand.
Compared to exactly one year ago, the supply of homes is down:
- 32.6% in Metro Denver
- 25.1% in Northern Colorado
An interesting and useful measurement we track is months of inventory. This stat tells how long it would take to sell all of the homes currently for sale at the current pace of sales.
Of course, months of supply can vary greatly by price range and location. However, this stat does a good job of explaining the overall state of the market.
Specifically, months of supply tells us if the market is in balance.
A ‘balanced’ market is when there is 4 to 6 months of supply. A buyers market occurs when the stat is higher than this range. A sellers market occurs when it is lower.
The months of supply looks like this in our market:
- 1.0 months in Metro Denver
- 1.3 months in Northern Colorado
So, the market overall is significantly under-supplied and more homes are needed to meet demand.

Caught Up

We’ve been waiting for June to catch up. It finally happened (almost).
Back in April, real estate activity was significantly limited and the showing of property was restricted which caused the number of closed properties in May and early June to be much lower than last year.
Bottom line, fewer properties going under contract in April caused fewer closings 30 to 45 days later.
Closed properties in May were down compared to 2019 by 44% in Northern Colorado and 43% in Metro Denver.
Then activity jumped significantly in May. The number of properties going under contract was way up compared to last year.
We’ve been wondering when we would see this sales activity reflected in the number of closed properties.
Well, it finally happened (almost).
The number of closings so far in June compared to the same time period through June of 2019 is only down 1.8% in Northern Colorado and 1.6% in Metro Denver.
In both markets, there are only a handful of closings separating activity in June 2020 versus June 2019.
By the end of the month, when all the transactions are tallied up, we expect that June of this year will out pace June of last year in terms of number of transactions.
This is significant not only because of COVID-19, but also because of the reduced inventory compared to last year. Quite simply, there are fewer homes to buy.
All of this speaks to the health and resiliency of the Front Range market.

Tight Inventory
The numbers that we find to be most interesting right now are all related to inventory.
Long story short, inventory is tight.
It was already tight pre-coronavirus and now it’s even tighter.
Here are the numbers.
Active properties for sale versus one year ago are down:
- 11% in Larimer County
- 20% in Weld County
- 26% in Metro Denver
This low inventory is one of several reasons that prices are generally still up across the Front Range.

Why No Crash

This week we hosted our clients and friends for a special online event with our Chief Economist Matthew Gardner.
Matthew talked about a variety of topics that are on people’s mind right now including home values.
Matthew sees no evidence that home values will crash and actually sees signs that they may rise this year nationally.
Here’s why he says this:
- Mortgage rates will remain under 3.5% for the rest of the year so there won’t be any interest-rate pressure on prices
- Inventory, which was already at record-lows, will drop even further keeping the supply levels far below normal
- New home construction will continue to be under-supplied and will be nothing like the over-supplied glut of inventory that we saw in 2008
- The vast majority of employees being laid off and furloughed are renters
- Homeowners have a tremendous amount of equity in their homes right now compared to 2008 which will prevent an influx of short sales and foreclosures
If you would like to receive a recording of the webinar we would be happy to send it to you. Feel free to reach out and ask for the link.

H
