There are several reasons why our Chief Economist does not believe there is a housing bubble today in the U.S.
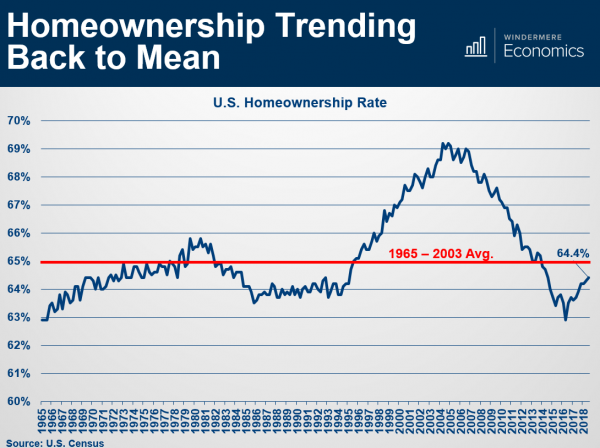
Below is a slide he shared at our recent market Forecast events.
It shows U.S. Home ownership rate, which is simply the percentage of the population who own their home (versus renting).
The long-term average is 65% represented by the red line.
In the graph you can clearly see the bubble forming. Starting in the mid-90’s, driven by several political and economic factors, more people than ever before became homeowners.

Then, starting in, 2008, the bubble burst and the percentage tumbled back down.
Now, as you can see, we are back at a “normal” level that resembles the long-term average.
________________________________________
If you would like a copy of the entire Forecast presentation, go ahead and reach out to us. We would be happy to put it in your hands.
 Facebook
 X
X
 Pinterest
 Copy Link
