
 Facebook
 Twitter
 Pinterest
 Copy Link
Reduced


Some fascinating research from the Denver Metro Association of Realtors…
37% of properties that sold last month along the Front Range had a price reduction at some point during the listing period.
Property owners who have to reduce their price take an average of 58 days to receive an offer.
Those who don’t have to reduce their price only take 13 days.
This stat obviously speaks to the importance of pricing your property right on day one.
Big Bounce

Seventy-five major metro markets have seen home prices bounce back to above their pre-recession peaks.
Metro Denver has seen the biggest bounce with home values 91% above its previous high in 2007 , according to the Home Price Recovery Index from HSH.com.
“Aside from routinely strong home price appreciation, it’s important to know that the Denver metro’s housing ‘bust’ in 2008 was relatively short and shallow,” said Keith Gumbinger, the report’s author.
The peak-to-trough for home values was only three years long and the total decline in value was just under 8 percent in Metro Denver, he said.
By contrast, a half-dozen large metros have seen home prices more than double from their lows and still not reach the old highs. On that list are Las Vegas, Sacramento, Calif, and Cape Coral, Fla.
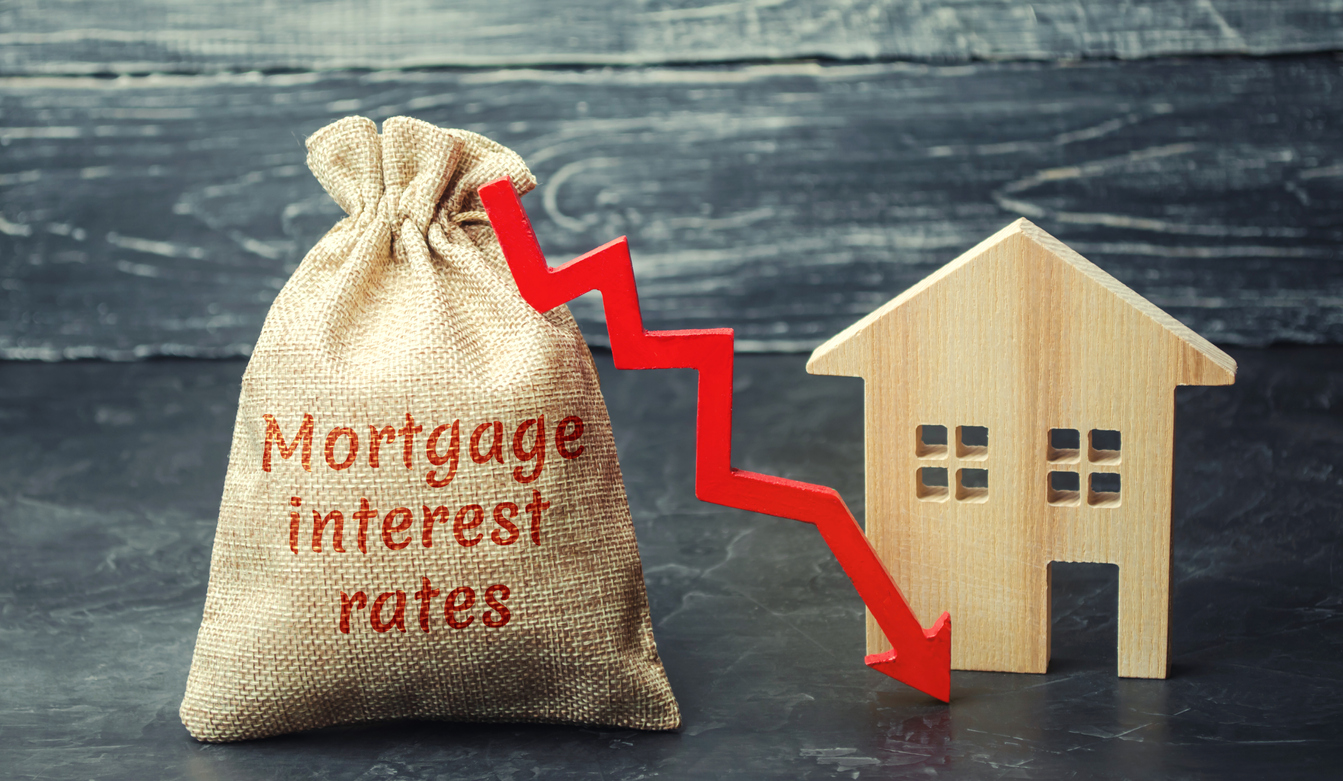
Rate Bounce

 Rates hit near-historic lows this week and are now at 3.49% for a 30-year mortgage.
There have only been two other times in history when rates have been this low- April 2013 and October 2016.
It’s interesting to see what happened soon after bottoming out these last two times.
In April of 2013 rates hit 3.41%. By August 2013 they had jumped to 4.40%.
Rates bottomed again in October 2016 at 3.42%. Just two months later in December 2016 they were 4.32%.
Each time the increase was nearly 1% within just a few months.
So, if history proves itself as a guide, we can’t expect these rates to last for long.
Case-Shiller

The Case-Shiller Home Price Index is a well-known report in the real estate industry and a valuable way to gauge what is happening in various markets across the Nation.
The report tracks home price appreciation in the 20 largest markets in the country.
Their most recent report shows that, Nation-wide, home prices are up 2.1% year-over-year.
Last year prices were rising at 6.3%. So, prices are still going up but not as fast as they were.
The city with the highest appreciation over the last 12 months is Phoenix with 5.8% growth followed closely by Las Vegas at 5.5%.
Denver came in at 3.4% which makes it tied for 8th place out of the 20 cities.
A Closing Window
For home sellers who would like to move to a new home this year, there is a window of time that is closing as we head into the Fall months.

Most people know that the Spring and Summer are the most active months for real estate and that activity trails off into the Fall and Winter.
Here are the specific numbers behind this…
The number of homes sold along the Front Range in November tends to be between 15% and 29% lower than September.
That means the best window of time for current sellers to obtain a contract from a buyer and close by the end of the year will occur over the next 45 days.
For sellers who have homes on the market today, it is time to ensure that:
- The home is priced right versus the competition
- All of the marketing elements are in place
- It is easy for a buyer to make an offer on the home
How Much?

So how much real estate is sold in Northern Colorado?
As it turns out, a lot!
Last month alone there were 1,099 single family homes that sold in Larimer and Weld Counties
The average price was $429,144 which means the total sales volume for one month was $471,629,129 (almost a half a billion)!
Over the last 12 months, just over $4.5 billion worth of single-family homes have sold.
That’s a lot of real estate!
On Sale
With interest rates so low, one could argue that money is essentially on sale.
It’s actually half off.
30-year mortgage rates hit 3.75% which is exactly half of their long term average.
Rates have averaged 7.5% over the last 40 years so today buyers are getting half of that rate.
The “sale” on mortgage rates creates a significant savings in monthly payment because of the 1%/10% rule.
For every 1% change in interest rate, the monthly payment will change roughly 10%.
So when rates go up to 4.75%, a buyer’s payment will be 10% higher.
For example, the principal and interest payment on a $400,000 home with a 20% down payment at today’s rates is $1,482.
If rates were 1% higher, the payments jump up to $1,669.
What We Notice

Here are some observations we have about the market right now:
- Inventory is up, price reductions are up, the length of time to sell a home is up
- Seller concessions are more prevalent
- Sellers are more willing to accept contingent offers (especially in higher price ranges)
- If a home doesn’t sell within a week, it often becomes stigmatized by the market and potential buyers assume there must be something wrong with it
- Homes that likely would have sold within hours a year ago, are now sitting on the market
- Condition is super-important as buyers become even more picky
- Pricing a property correctly on day one is paramount
- Sellers who over-price their property are finding themselves chasing the market
Home-ownership Rate

An interesting stat which can give some insight to the national market is the Home-ownership Rate.
It simply looks at the percentage of Americans who own their home instead of rent.
The most recent report from the Census Bureau shows the rate at 64.2%.
Most importantly, this number is showing stability after many years of change.
After many years of hovering around 64%, the Home-ownership Rate started increasing in 1996 and reached as high as 69.5% in 2005.
2008 started several years of declining back to the pre-1996 levels of 64%.
So today it’s back to what seems to be “normal” based the long-term average.
Compound Effect

If you have driven on I-25 lately you may have noticed that the Front Range is a popular place.
The projections show that it will only get more popular in the future.
Today, 4.8 million people live along the Front Range from Fort Collins down to Pueblo.
In 2030, just 11 short years from now, 5.7 million people will live here. Yes, that’s almost 1 million more than today.
This is all according to the Colorado State Demographers Office.
While this seems like a big increase, keep in mind that this assumes that population growth occurs at a fairly modest 1.7% per year.
It seems that our state will continue to grow and there will continue to be a demand for housing.
