
 Facebook
 Twitter
 Pinterest
 Copy Link
Rebound

The Case-Shiller Home Price Index tracks appreciation in the 20 largest real estate markets across the U.S.
Their most recent quarterly report was just released this week.
Metro Denver prices are up over last year by 3.89% which is just slightly higher than the average of the 20 markets.
It is interesting to see how the 20 locations have performed since the pre-Great Recession housing peak.
Turns out that Denver has done the best out of all the markets.
Since 2008, Denver home prices have appreciated 64.9%. Second-best is Dallas at 55.5% and Seattle is third at 41.2%.
Believe it or not, there are markets where average home prices have still not returned to their 2008 levels.
Las Vegas is 14.5% below 2008 and Chicago is 12.8% below.
These numbers are another indicator of the long-term health and performance of the Front Range market.
Special Event

On Wednesday April 22nd you are invited to a special online event with Windermere’s Chief Economist Matthew Gardner.
He will be giving his insights into the U.S. economy and what that means for real estate along the Front Range of Colorado.
You will hear the answers to the biggest questions we are hearing from clients now like “do you think housing prices will crash?”
This event is exclusively for clients and friends of Windermere Real Estate. To receive the registration link simply comment on this blog or reach out to your Windermere real estate broker.
Many of you have heard Matthew speak at our Market Forecast events we hold each year in January. He is famous for making complex economic dynamics very simple to understand.
You will get useful and valuable information which will give you clarity about where the market is headed and when we can expect the economy to improve.
For example Matthew predicts unemployment to hit 15% by the end of June, but then to improve to 8% by year-end and 6% by this time next year.
Again, if you would like the link just comment on this blog or reach out to your Windermere broker.
Get Real

We’ve seen some headlines recently that suggest home prices along the Front Range have peaked and are starting to decline.
When we dig in and do the research, this is what we find…
Home prices are still going up, just not as fast as they have been.
We’ve known that the double-digit appreciation that we’ve seen for the last several years could not be sustained and we expected the pace of appreciation to slow down.
So far in 2019, this is the case. Prices still going up, just not as fast.
It’s like running up stairs. Eventually you will get tired and you will need to start walking (but you’re still going up).
Headlines that suggest that prices have peaked and are falling create unrealistic expectations for buyers and give sellers a skewed perspective on the market.
Here are the numbers…
Average Price:
- Up 1.53% in Metro Denver
- Up 6.1% in Larimer County
- Up 5.1% in Weld County
Months of Inventory:
- 5 Months in Metro Denver
- 5 Months in Larimer County
- 4 Months in Weld County
- (Remember that 4-6 months of inventory represents a balanced market)
There has been an increase in Days on Market which means that homes are taking longer to sell. But the increase is measured in days, not months.
Here are those numbers…
Days on Market:
- Up 4 Days in Metro Denver
- Up 11 Days in Larimer County
- Up 3 Days in Weld County
So, be mindful of headlines that can be sensationalized and might suggest that the market is falling.
Bottom line, the market is going up, just not as fast as it was.
The Cost of Waiting

It’s true, certain parts of our market are cooling off. We are seeing fewer multiple offers, fewer bidding wars, and fewer inspection concessions.
However, homes that are priced right and in great condition are selling, and in many cases, selling quickly.
As buyers feel the market cool a bit, it may cause them to want to wait. They sometimes feel like it’s a better choice to ‘wait and see what happens.’
The reality is, there is a real cost to waiting given two specific facts.
1. Interest rates will continue to rise
2. Prices will continue to rise
Interest rates are a little more than 0.5% higher than a year ago and experts predict them to be another 0.5% higher by this time next year.
Prices have been appreciating at roughly 10% per year for the last four years. Based on the numbers, we see that appreciation could be 5% per year for the next two years.
So, let’s look at a house priced at $450,000 today. If prices go up “only” 5% for the next 12 months, that home will cost $22,500 more in a year.
And, if rates go up another half percent, the monthly payment will be $206 higher. That’s an 11% increase!
In an environment of rising prices and rising rates, there is a real cost to “wait and see.”
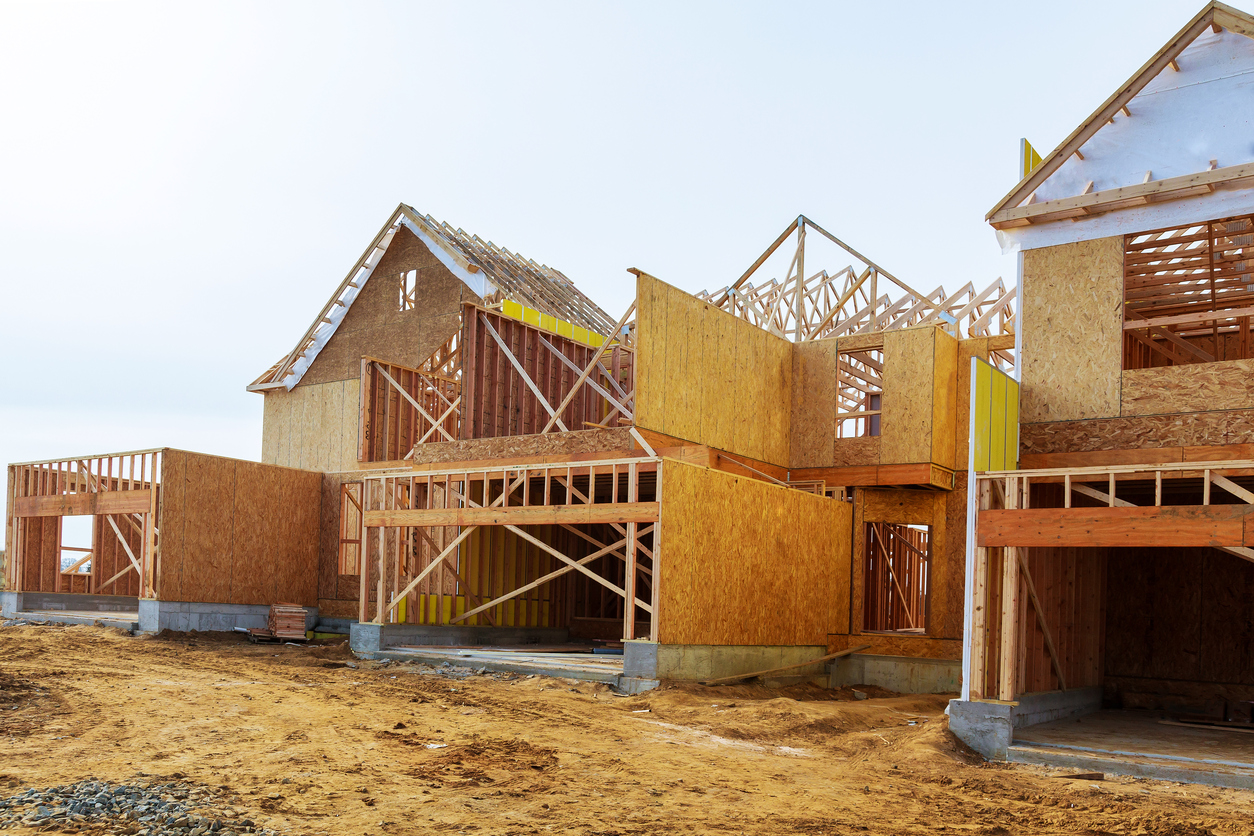
When Buying a Short Sale Home is the Right Fit


Purchasing a home can feel overwhelming at times, but a short sale home offers a unique opportunity for a prospective buyer. A short sale occurs when a homeowner owes a lender more than their home is worth, and the lender agrees to let the owner sell the home and accept less than what is owed. Lenders may agree to a short sale because they believe it will net them more money than going forward with a lengthy and costly foreclosure process.
Short sales do differ in a number of ways from conventional home sales. Here are a few things to consider if you’re thinking about buying a short sale property.
- Short sale homes sell for less, but not significantly less than market value.
Buyers hoping to snap up a home for half the market value will be disappointed. The selling price for short sales averages about 10 percent less than for non-distressed properties. The bank is looking to recover as much of the value of the home as possible, so they will not accept offers that are significantly under market value. That said, with savings that can equal tens of thousands of dollars, a short sale is a great way to get more house for your money.
- Short sale properties are sold “as is”.
The lender will not be making repairs to the home. Any improvements that need to be made are most likely going to be the responsibility of the buyer. A savvy buyer’s agent/broker will get contractor bids for any necessary repairs and use those to help negotiate a lower sales price with the bank.
- A short sale will take longer than a conventional home sale.
Once you and the seller have mutual acceptance on an offer, you need to allow 60 to 90 days for the lender approval process. There are often long stretches when the offer is slowly winding its way through the bank’s system, so buyers need to be patient.
- If you have to sell your home first, a short sale is probably not the best fit.
Lenders generally will not take contingent offers on a short sale.
- A short sale is one real estate transaction that you shouldn’t attempt on your own.
Short sales are complicated transactions that involve a different process and significantly more paperwork than a standard real estate sale. An agent/broker that is unfamiliar with short sales can write an offer in such a way that they inadvertently cause their buyers to lose the deal. An experienced short sale agent/broker will protect your interest and help the process move forward smoothly.
The bottom line: As long as you can be patient, and are working with an agent/broker who understands the process, buying a short sale is a great way to purchase the house you want at a price you’ll love.
Colorado Real Estate Market Update


The following analysis of the Metro Denver & Northern Colorado real estate market (which now includes Clear Creek, Gilpin, and Park Counties) is provided by Windermere Real Estate Chief Economist Matthew Gardner. We hope that this information may assist you with making better-informed real estate decisions. For further information about the housing market in your area, please don’t hesitate to contact your Windermere agent.
ECONOMIC OVERVIEW
Colorado continues to see very strong job growth, adding 72,800 non-agricultural jobs over the past 12 months—an impressive increase of 2.7%. Through the first five months of 2018, the state added an average of 7,300 new jobs per month. I expect this growth to continue through the remainder of the year, resulting in about 80,000 new jobs in 2018.
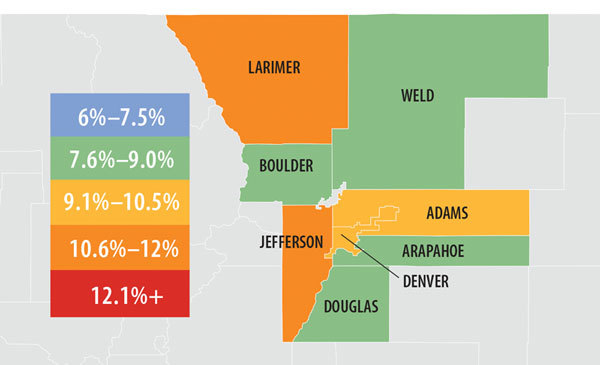
In May, the state unemployment rate was 2.8%. This is slightly above the 2.6% we saw a year ago but still represents a remarkably low level. Unemployment remains either stable or is dropping in all the markets contained in this report, with the lowest reported rates in Fort Collins and Boulder, where just 2.2% of the labor force was actively looking for work. The highest unemployment rate was in Grand Junction, which came in at 3.1%.
HOME SALES ACTIVITY
- In the second quarter of 2018, 17,769 homes sold—a drop of 2.4% compared to the second quarter of 2017.
- Sales rose in 5 of the 11 counties contained in this report, with Gilpin County sales rising by an impressive 10.7% compared to second quarter of last year. There were also noticeable increases in Clear Creek and Weld Counties. Sales fell the most in Park County but, as this is a relatively small area, I see no great cause for concern at this time.
- Slowing sales activity is to be expected given the low levels of available homes for sale in many of the counties contained in this report. That said, we did see some significant increases in listing activity in Denver and Larimer Counties. This should translate into increasing sales through the summer months.
- The takeaway here is that sales growth is being hobbled by a general lack of homes for sale, and due to a drop in housing demand.

HOME PRICES

- With strong economic growth and a persistent lack of inventory, prices continue to trend higher. The average home price in the region rose
9.8% year-over-year to $479,943. - The smallest price gains in the region were in Park County, though the increase there was still a respectable 7%.
- Appreciation was strongest in Clear Creek and Gilpin Counties, where prices rose by 28.9% and 26%, respectively. All other counties in this report saw gains above the long-term average.
- Although there was some growth in listings, the ongoing imbalance between supply and demand persists, driving home prices higher.

DAYS ON MARKET
- The average number of days it took to sell a home remained at the same level as a year ago.
- The length of time it took to sell a home dropped in most markets contained in this report. Gilpin County saw a very significant jump in days on market, but this can be attributed to the fact that it is a very small area which makes it prone to severe swings.
- In the second quarter of 2018, it took an average of 24 days to sell a home. Of note is Adams County, where it took an average of only 10 days to sell a home.
- Housing demand remains very strong and all the markets in this report continue to be in dire need of additional inventory to satisfy demand.

CONCLUSIONS

This speedometer reflects the state of the region’s real estate market using housing inventory, price gains, home sales, interest rates, and larger economic factors.
For the second quarter of 2018, I have moved the needle very slightly towards buyers as a few counties actually saw inventories rise. However, while I expect to see listings increase in the coming months, for now, the housing market continues to heavily favor sellers.

Matthew Gardner is the Chief Economist for Windermere Real Estate, specializing in residential market analysis, commercial/industrial market analysis, financial analysis, and land use and regional economics. He is the former Principal of Gardner Economics, and has more than 30 years of professional experience both in the U.S. and U.K.
Nationally Speaking
Here are some interesting stats on the national real estate market shared by Windermere’s Chief Economist, Matthew Gardner at our Market Forecast two weeks ago:
- The Case-Shiller Home Price Index, which tracks 20 markets around the country, is still 12% below it’s 2005 peak when adjusted for inflation.
- New Home starts in 2018 are projected to be 900,000. In 2005 there were 1.7 million.
- The average length of time someone lives in a home is now at 8.2 years. In the year 2000 it was 4.2 years.
The homeownership rate now sits at 64% which is 1% below the long-term average. In 2005 it spiked to almost 70%
Should You Wait out the Housing Market?
The housing market is remarkably tight across the U.S., and you may be wondering if you should wait for home prices to slow before making your move. Windermere’s Chief Economist, Matthew Gardner, shares why waiting could end up costing you more money in the long run.
Northern Colorado Market Forecast Overview
Did you miss our Northern Colorado real estate market forecast or do you just want a quick refresher?
Windermere Colorado’s President, Eric Thompson, gives you a recap of what we discussed and what we predict will happen with the housing market in the upcoming years.
A few key points from Matthew Gardner, co-presenter at the forecast and Windermere Real Estate’s very own Chief Economist:
OVERVIEW
Annual employment growth in Colorado was measured at a respectable 2.2% in November and will likely finish the year having created around 55,000 new jobs. Within the metropolitan market areas included in this report, we are seeing employment growth at or above the state level and I anticipate that this will continue to be the case in 2017.
Unemployment rates continue to drop, and with rates now below three percent, all of Colorado’s metro areas are at full employment. Because of this robust level of growth—in concert with very low unemployment levels—I anticipate that we will see some fairly substantial income growth as companies look to recruit new talent and keep existing employees happy.
HOME SALE ACTIVITY
- There were 14,614 home sales during the fourth quarter of 2016—up by a marginal 0.7% from the same period in 2015.
- Jefferson County saw sales grow at the fastest rate over the past 12 months, with a 5.9% increase. Sales activity fell in three counties, but this was a function of short supply rather than slowing demand.
- Listing activity continues to remain well below historic averages, with the total number of homes for sale in the fourth quarter 12.8% below that seen a year ago.
- The key takeaway from this data is that 2017 is shaping up to be one which will still substantially favor home sellers. I do anticipate that we will see some improvement in listing activity, but it is almost a certainty that demand will exceed supply for another year.
HOME PRICES

- Demand continued to exceed supply in the final three months of 2016 and this caused home prices to continue to rise. In the fourth quarter, average prices rose by 9% when compared to the fourth quarter of 2015. The average sales price across the region is now $393,969.
- In many parts of the region, prices are well above historic highs and continue to trend upward. With double-digit price increases over the past year, the market remains very hot.
- Annual price growth was strongest in Larimer and Jefferson Counties, where prices rose by 11.8% and 10.9% respectively.
- While we will likely see some modest softening in home price growth in 2017, we can still expect a very strong market.
Interesting Takeaways

The Zillow Group just completed an extensive survey of home buyers and sellers. Here are some interesting takeaways from the research:
- Half of today’s home buyers are under the age of 36, and 47 percent are first-time buyers. Solo home buyers are in the minority;
 most buyers are shopping with a spouse or partner (73 percent).
 - Eighty-three percent of buyers are shopping for a single-family house. Their top considerations are affordability and being in a safe neighborhood.

- Today’s sellers are most often members of Generation X (38 percent), and the majority (63 percent of all sellers) are listing a home for the first time.
- Most sellers are trading their homes for one they see as an upgrade, seeking a median of 100 more square feet and a home that costs an average of 11 percent more.
- Sellers’ top regret was that they didn’t take more time to prepare for a sale (30 percent). (By the way, Windermere’s Certified Listing is a proven 10-step process which prepares both the home and our clients for the sale. Let us know if you want to know more about it.)
