
 Facebook
 Twitter
 Pinterest
 Copy Link
Party Like It’s 2018!

Just a few months ago most people thought mortgage rates were heading to 5% and now they are back to where they were a year ago.
You probably saw this week’s news from the Federal Reserve declaring that they would not raise their Federal Funds rate for the rest of 2019
(just three months after saying they would raise rates at least twice this year).
While this is big news, even bigger news for mortgage rates is that the 10-year Treasury yield just hit its lowest point since January 2018. One thing we’ve learned from our Chief Economist Matthew Gardner is that mortgage rates follow the 10-year treasury (not necessarily the Fed Funds rate).
Last Spring it looked like mortgage rates had bottomed out and they steadily climbed through the Summer and Fall of 2018. It looked certain that they would hit 5% around January.
Instead they started dropping. Now with the 10-year Treasury at a 15-month low, they just dropped a little more and they are back to where they were a year ago.
Great news for buyers! Party like it’s 2018!
Condo Cyclone
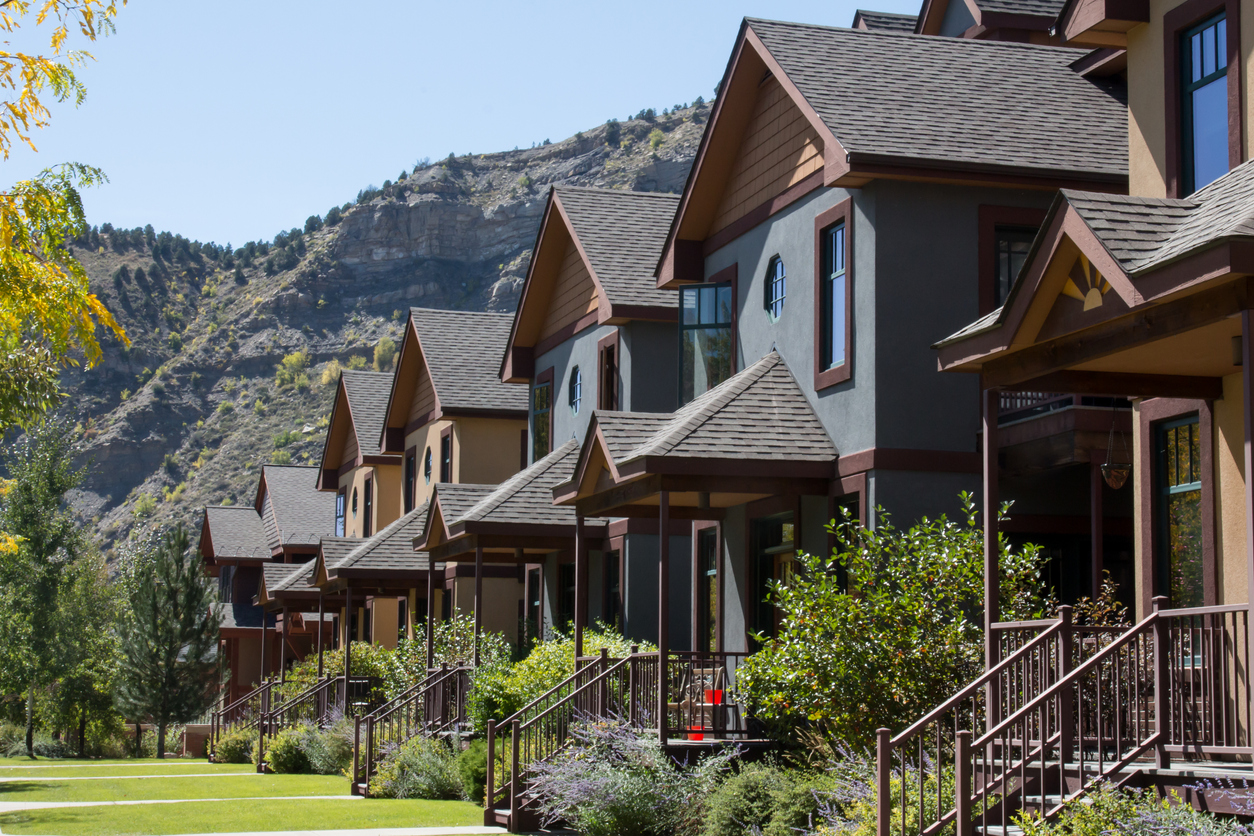
While the “Bomb Cyclone” closed roads and schools over the last two days, the “Condo Cyclone” is opening new opportunities for first-time buyers.
What’s the “Condo Cyclone” you ask. It’s the proliferation of multi-family inventory that has come on the market up and down the Front Range.
Compared to last year, multi-family inventory which includes town-homes and condominiums, has increased…
• 79% in Metro Denver
• 34% in Larimer County
• 45% in Weld County
This is terrific news for the market overall, as inventory has been unusually low for several months. It’s especially terrific news for first-time buyers who need this type of product as a stepping stone to home ownership.
What we notice is a $170,000 to $130,000 difference in average price between a single-family home and a multi-family home in Front Range markets.
Specifically, here’s the spread between multi-family and single-family average price:
• $349,801 vs. $512,312 in Metro Denver
• $312,493 vs. $469,294 in Larimer County
• $237,645 vs. $370,027 in Weld County
So as we dig out from the “Bomb Cyclone” we can be happy for the “Condo Cyclone” which brings more affordability and opportunity to our markets!
______________________________________________________________________
Just Released (a new resource site just for you…)
• Want to see the latest market trends?
• Curious to see the process of buying or selling a home?
• Interested in what it takes to own investment property?
• Be sure to visit www.ColoradoLivingBlog.com
The Office

As you travel around the Front Range you will notice the following under construction:
- New Homes
- New Apartments
- New Medical Facilities
However, you will not notice new office buildings under construction.
What gives? I thought we had a booming economy. Why no new office buildings?
There are a couple of reasons. First, construction costs have sky rocketed. In ten years, construction costs have gone from about $200 per square foot to over $300 per square foot.
Rental rates have not increased at the same pace as construction costs so speculative investors can’t make their numbers work.
It’s too expensive to build compared to the rents that can be charged.
One reason why rental rates haven’t increased at high rate is property taxes. Property taxes on Class A office buildings have basically doubled in the last 10 years in many cases.
So, until rental rates catch up with construction costs, we won’t see many new office buildings under construction.
Vegas Baby!

The results are in from FHFA.gov’s latest ranking of the top performing markets in the U.S.
Each quarter they track 245 cities across the country and rank their real estate markets by home price appreciation.
What’s the highest performing city the the U.S.
Vegas! Their prices have gone up 17.63% in the last year.
How about the worst?
Bloomington, Illinois sits in dead last where prices went down 3.58%
Here’s how Colorado cities are ranked:
• #10 Colo. Springs = 11.41%
• #16 Greeley = 10.68%
• #59 Fort Collins = 8.29%
• #64 Denver = 8.15%
• #97 Boulder = 6.85%
Why No Bubble
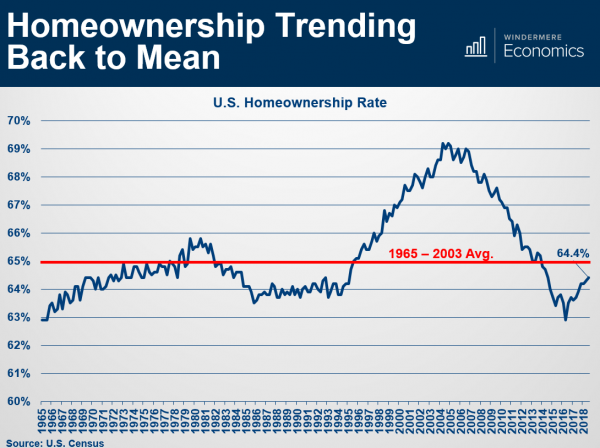
There are several reasons why our Chief Economist does not believe there is a housing bubble today in the U.S.
Below is a slide he shared at our recent market Forecast events.
It shows U.S. Home ownership rate, which is simply the percentage of the population who own their home (versus renting).
The long-term average is 65% represented by the red line.
In the graph you can clearly see the bubble forming. Starting in the mid-90’s, driven by several political and economic factors, more people than ever before became homeowners.

Then, starting in, 2008, the bubble burst and the percentage tumbled back down.
Now, as you can see, we are back at a “normal” level that resembles the long-term average.
________________________________________
If you would like a copy of the entire Forecast presentation, go ahead and reach out to us. We would be happy to put it in your hands.
Misery Index
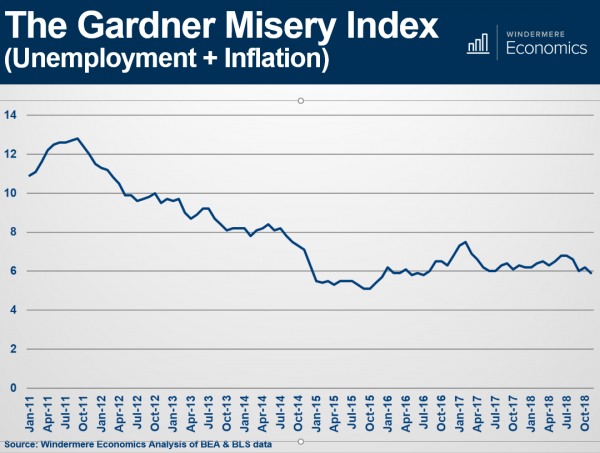
Last week at our Market Forecast events, Chief Economist Matthew Gardner shared, among many stats, his famous “Misery Index.”
A valuable statistic with a funny title.
The Misery Index simply measures inflation plus unemployment.
It’s an effective way to look at our Nation’s economy.
Today’s Index sits just below 6%. Back in October 2011, it was close to 13%.
The lowest it has been in the last 7 years is October 2015 when it was near 5%.
________________________________________
If you would like a copy of the entire Forecast presentation, go ahead and reach out to us.
We would be happy to put it in your hands.
Our Forecast
This past Wednesday and Thursday evenings we had the pleasure of hosting our annual Market Forecast events in Denver and Fort Collins.
Thank you to the 700 people who attended. We appreciate your support!
In case you missed the events, here are some highlights including our forecast for price appreciation in 2019:
• In 2018 Prices went up:
o 8% in Fort Collins
o 8% in Loveland
o 8.5% in Greeley
o 8% in Metro Denver
• Inventory is (finally) showing signs of increasing:
o Up 25% in Northern Colorado
o Up 45% in Metro Denver
• There are distinct differences in months of inventory across different price ranges = opportunity for the move up buyer.
• There are several reasons why we don’t see a housing bubble forming:
o New home starts along the Front Range are roughly 60% of pre-bubble highs 14 years ago.
o Americans have more equity in their homes than ever, $6 Trillion!
o The average FICO score of home buyers is significantly higher than the long-term average.
o The home ownership rate is back to the long-term average.
• Our 2019 Price Appreciation Forecast:
o 6% in Fort Collins
o 6% in Loveland
o 7% in Greeley
o 6% in Metro Denver
If you would like a copy of the presentation, go ahead and reach out to us. We would be happy to put it in your hands!
More Choices

Great news for buyers! There are more homes to choose from. It seems there is relief from the days of drastically low inventory levels.
Compared to a year ago, residential inventory levels are up:
• 9% in Northern Colorado (Larimer & Weld Counties)
• 45% in Metro Denver (wow!)
________________________________________
You can get many more fun facts like these plus get our predictions on the 2019 market by joining our annual Market Forecast. Just click the link below!
https://www.eventbrite.com/o/windermere-real-estate-12011801121
Still Up

All the talk of the market cooling off might make someone think that prices must be going down.
The truth is prices are still going up.
Here are the latest year-over-year appreciation numbers from the Federal Housing Finance Authority (they track 243 markets all across the Country):
Colorado Springs 11.44%
Greeley 10.53%
Denver 9.97%
Boulder 9.89%
Fort Collins/Loveland 8.64%
Waiting and Waiting

Anytime the market cools off we sometimes hear prospective buyers say “I think I’ll wait for the market to correct, then I’ll buy after prices come way down.”
The reality is this… History shows that this wouldn’t be a good strategy.
Our go-to source on price appreciation is the Federal Housing Finance Authority who produces a quarterly home price index. They have been tracking Larimer County for 41 years.
Their numbers show:
- Yearly prices have decreased only 6 times in history
- The average amount of that decrease is only 1.7%
So, someone who is waiting for prices to drop:
- Might be waiting a long time
- Might be disappointed that prices didn’t drop by all that much
